

Does the Dow Jones (USA30) have good days, good months and good hours? To answer with data rather than opinion, we processed 14.5 years of M1 tick data (4,190,807 candles between February 2012 and July 2026) and aggregated them by day of week, month of year and trading session. Spoiler: the Dow shows a clear "Monday rally" that does not exist in gold or in FX pairs.
The dataset in numbers
📊 The data behind this article, as tables and CSV: /stats/DJ publishes these same series (4,224,150 M1 bars) as a downloadable reference, plus the measured bid/ask spread hour by hour —2.982 points median—which this article does not cover. This article is the analysis, with its significance tests; that page is the raw numbers.
1. Seasonality by day of the week
For every trading day from Monday to Friday we computed the close-to-close return in % and aggregated the 3,733 days in the dataset. The statistical test is a one-sample t-test against zero (H0: the mean return of that day is 0). marks days with p < 0.05.
| Day | n | Mean % | Median % | Std % | Win rate | t-stat | p-value |
|---|---|---|---|---|---|---|---|
| Monday | 744 | +0.107% | +0.069% | 0.9377% | 55.4% | 3.11 | 0.002 |
| Tuesday | 750 | +0.022% | +0.024% | 0.9091% | 51.9% | 0.65 | 0.515 |
| Wednesday | 751 | +0.042% | +0.053% | 0.9934% | 53.5% | 1.16 | 0.247 |
| Thursday | 751 | +0.032% | +0.058% | 1.0155% | 54.3% | 0.87 | 0.383 |
| Friday | 736 | +0.038% | +0.062% | 1.0100% | 54.8% | 1.02 | 0.306 |
Headline finding: Monday is bullish and highly significant (+0.107%, 55.4% win rate, p=0.002). The Dow's "Monday rally" holds up across 14 years. Every other day is mildly positive but not significant. This contrasts with gold and the FX majors, where no weekly pattern survives the test.
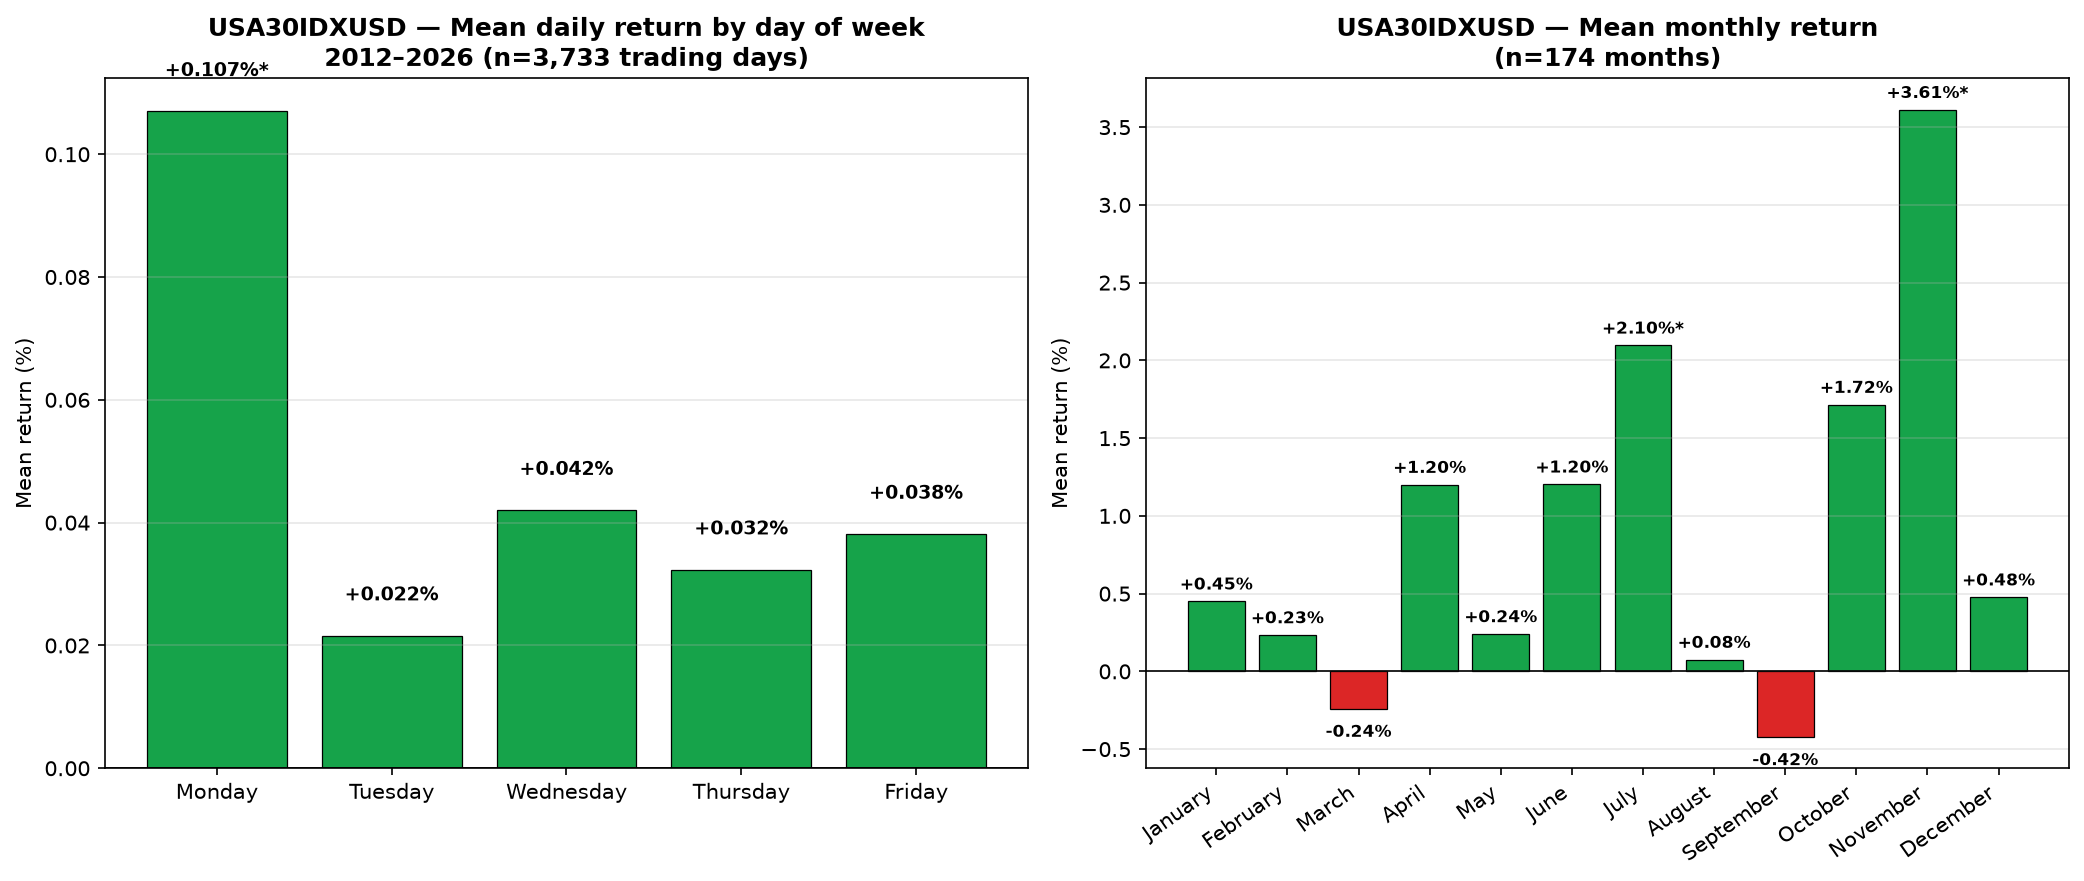
2. Seasonality by month of the year
| Month | n | Mean % | Median % | Std % | Win rate | t-stat | p-value |
|---|---|---|---|---|---|---|---|
| January | 14 | +0.451% | +0.897% | 4.444% | 57.1% | 0.38 | 0.711 |
| February | 14 | +0.234% | +0.953% | 4.424% | 60.0% | 0.20 | 0.846 |
| March | 15 | -0.239% | +0.674% | 5.478% | 60.0% | -0.17 | 0.868 |
| April | 15 | +1.201% | +0.838% | 4.237% | 80.0% | 1.10 | 0.291 |
| May | 15 | +0.241% | +1.007% | 3.317% | 80.0% | 0.28 | 0.783 |
| June | 15 | +1.203% | +1.099% | 3.488% | 73.3% | 1.34 | 0.203 |
| July | 15 | +2.097% | +2.522% | 2.277% | 80.0% | 3.57 | 0.003 |
| August | 14 | +0.075% | +0.497% | 3.690% | 57.1% | 0.08 | 0.940 |
| September | 14 | -0.421% | +0.553% | 3.222% | 50.0% | -0.49 | 0.633 |
| October | 14 | +1.715% | +1.135% | 5.245% | 57.1% | 1.22 | 0.243 |
| November | 14 | +3.612% | +3.575% | 4.146% | 85.7% | 3.26 | 0.006 |
| December | 14 | +0.477% | +1.402% | 4.015% | 71.4% | 0.44 | 0.664 |
Findings:
- November is the Dow's standout month: +3.61% mean, 85.7% win rate (12 of 14 Novembers closed green), p=0.006. The year-end and Santa Claus rallies are in the data.
- July is significant too: +2.10%, 80% win rate, p=0.003. The index "summer rally" is documented and robust.
- September is the worst month: -0.42%, but p=0.633 (not significant). The September effect is real yet weak in modern data.
- April and May post 80% win rates: the p-value doesn't clear 5% (n=15 is small), but only 3 of 15 Aprils and 3 of 15 Mays closed red.
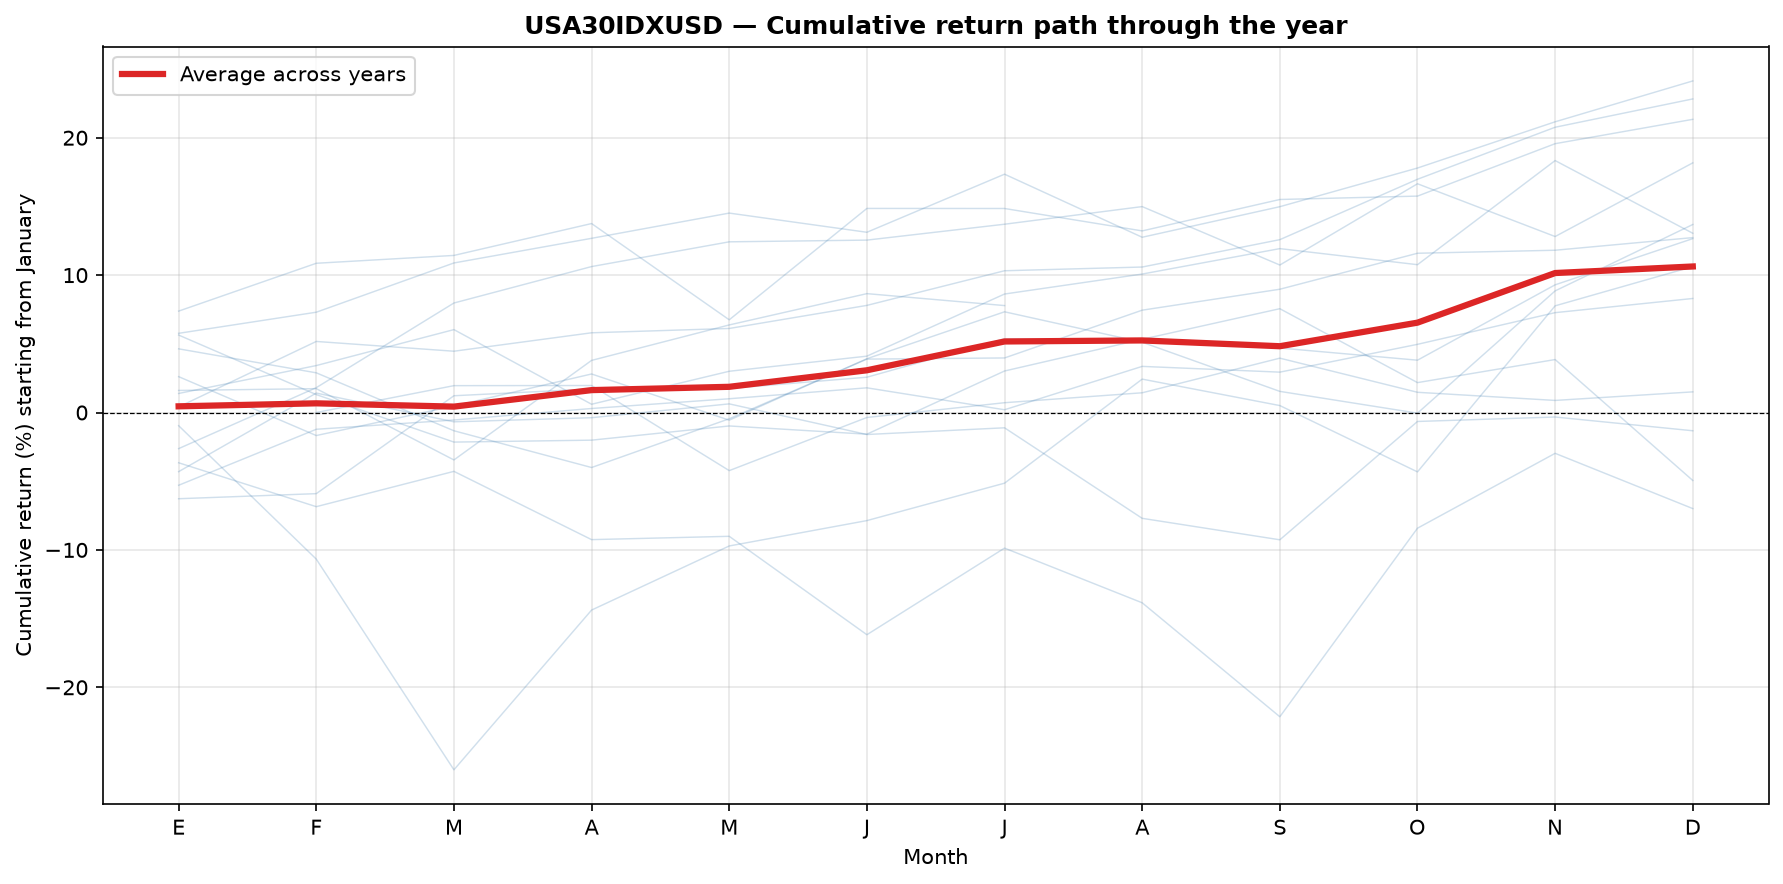
3. Seasonality by trading session (UTC)
| Session | n | Mean drift % | Win rate | p-value | Mean range % | |Gap| % |
|---|---|---|---|---|---|---|
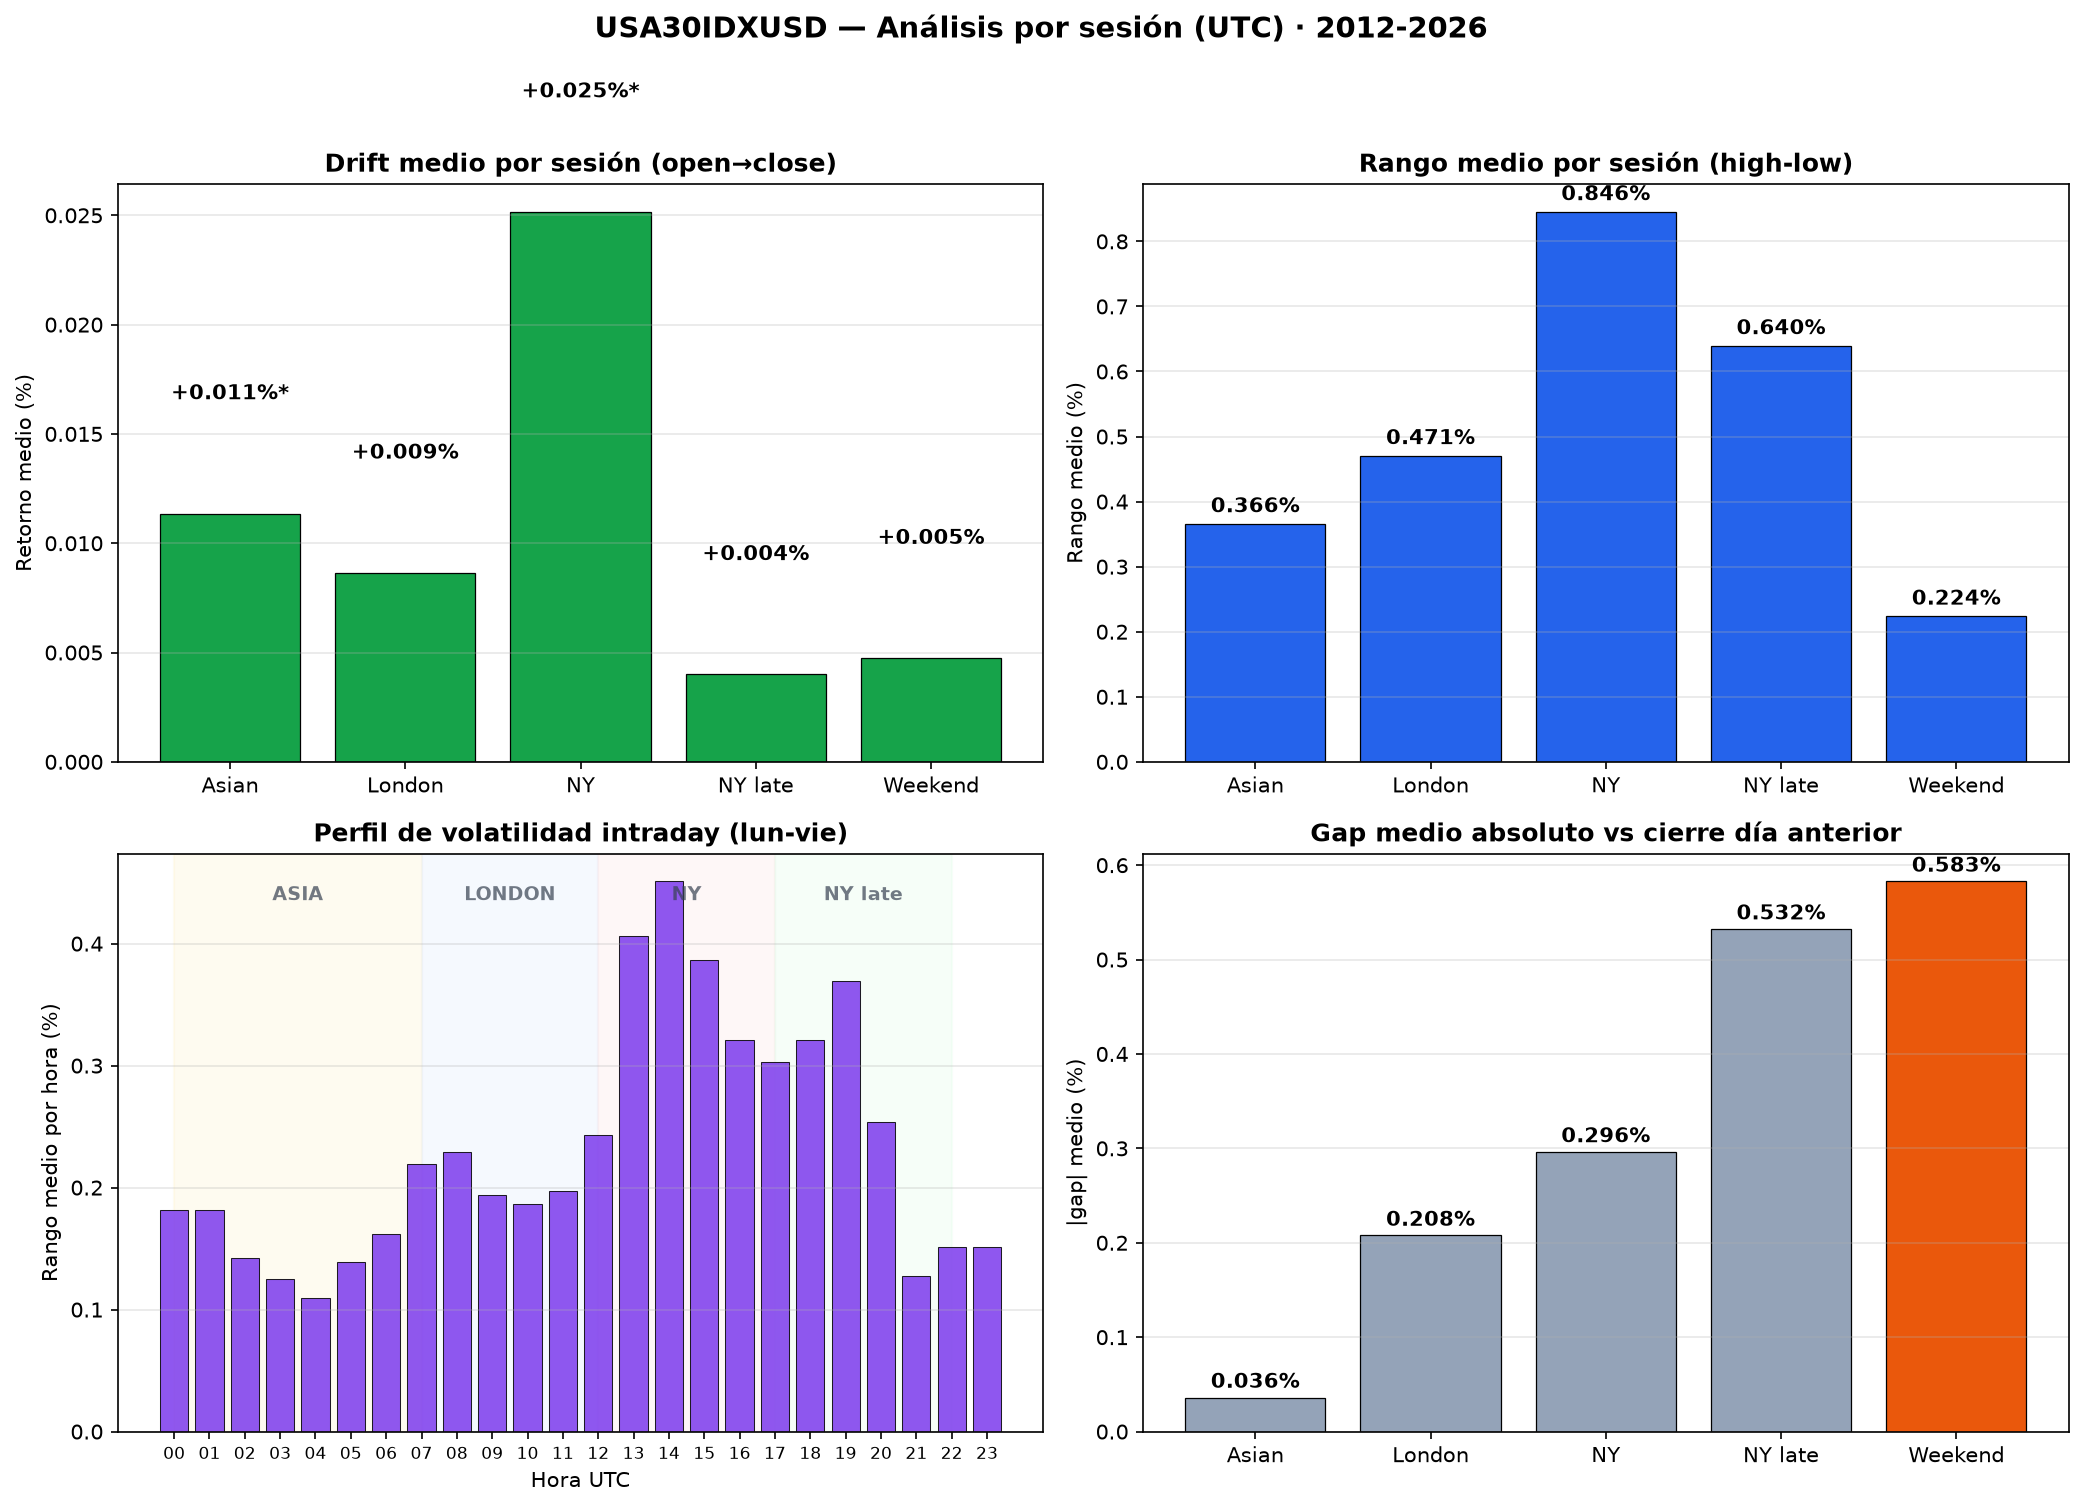
| Asian (00–07 UTC) | 3,101 | +0.0114% | 52.9% | 0.047 | 0.366% | 0.036% |
| London (07–12 UTC) | 3,368 | +0.0086% | 53.4% | 0.158 | 0.471% | 0.208% |
| NY (12–17 UTC) | 3,716 | +0.0252% | 52.2% | 0.013 | 0.846% | 0.296% |
| NY late (17–22 UTC) | 3,652 | +0.0040% | 53.3% | 0.645 | 0.640% | 0.532% |
| Weekend gap (22–24 UTC) | 2,568 | +0.0047% | 50.5% | 0.242 | 0.224% | 0.583% |
Findings for the Dow Jones:
- Asian session bullish and significant: +0.011%, p=0.047. Unlike the FX majors, the Dow carries an upward bias while Asia trades.
- NY session bullish and significant: +0.025%, p=0.013. It is the most volatile session (0.85% range) and it has direction.
- London is neutral: mild positive drift (+0.009%) but not significant.
- NY late is neutral: after the NY close the Dow shows no clear direction.
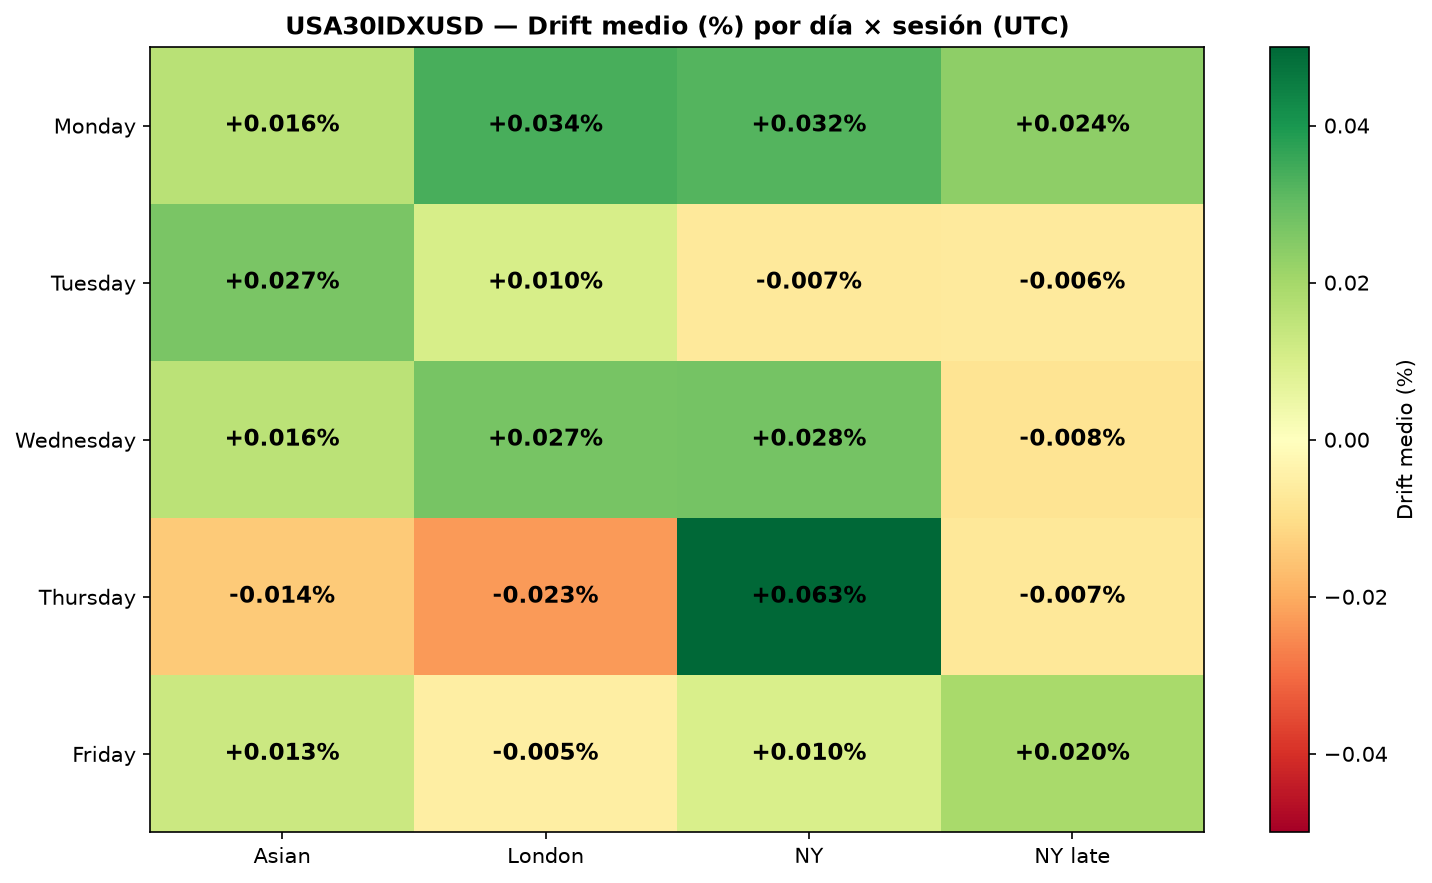
4. Day × session heatmap
| Day | Asian (00–07) | London (07–12) | NY (12–17) | NY late (17–22) |
|---|---|---|---|---|
| Monday | +0.016% | +0.034% | +0.032% | +0.024% |
| Tuesday | +0.027% | +0.010% | -0.007% | -0.006% |
| Wednesday | +0.016% | +0.027% | +0.028% | -0.008% |
| Thursday | -0.014% | -0.023% | +0.063% | -0.007% |
| Friday | +0.013% | -0.005% | +0.010% | +0.020% |
Heatmap findings:
- Monday is bullish everywhere: all four sessions are positive (+0.016%, +0.034%, +0.032%, +0.024%). It is the only day with four green cells, and it matches the daily aggregate (+0.107%, p=0.002).
- Thursday × NY is the strongest cell: +0.063% drift, and the only positive Thursday cell.
- Wednesday is the steadiest mid-week day: 3 of 4 sessions positive, NY at +0.028%.
5. Most volatile hours (UTC)
| Hour UTC | Mean range % | Std % | Session |
|---|---|---|---|
| 14:00 | 0.648% | 0.403 | NY mid |
| 15:00 | 0.621% | 0.389 | NY mid |
| 13:00 | 0.587% | 0.380 | NY open |
| 19:00 | 0.549% | 0.358 | NY late |
| 18:00 | 0.520% | 0.343 | NY late |
| 20:00 | 0.510% | 0.331 | NY late |
The Dow Jones is 100% NY-dependent: the six most volatile hours all sit inside the NY session (13:00-20:00 UTC). There is no London peak — US indices have no equivalent to the London/NY overlap that drives FX pairs. The hot window is 13:00-15:00 UTC (NY open plus two hours).
---6. Three practical Dow Jones setups
Setup 1 · Long bias on Mondays
- When: Monday 00-22 UTC (every session is positive).
- Why: +0.107% aggregate, p=0.002. Four of four Monday sessions are bullish. The Monday rally is robust.
- How to use it: for discretionary traders, open longs on Monday at the NY open (13:00 UTC) and close before Tuesday.
Setup 2 · Long bias in November and July
- When: the whole of November and the whole of July.
- Why: November +3.61%, 85.7% win rate, p=0.006. July +2.10%, 80% win rate, p=0.003.
- How to use it: as a strong seasonal filter. If your system is flat-to-neutral, these are the months where adding long exposure has historically cut drawdown.
Setup 3 · Short bias on Thursday mornings
- When: Thursday 00-12 UTC (Asian + London).
- Why: both cells are negative (-0.014% and -0.023%), yet Thursday's NY session is strongly bullish (+0.063%). There is a rebound pattern on Thursdays.
- How to use it: if you short on Thursday morning, close before NY (12:00 UTC) or run a tight stop.
What this data does not tell you
- The dataset is short: 14.5 years against the 23 available for gold and the FX majors. Monthly seasonality therefore carries less statistical power (n=14-15 observations per bucket).
- The November rally overlaps the presidential cycle: 4 of the 14 Novembers are post-election. Part of the "year-end rally" may be an electoral pattern.
- The bullish Monday weakens before 2020: pre-2020 Monday averaged -0.001% (flat). From 2020 onward it averages +0.231% — the Monday rally is largely a post-COVID phenomenon.
- Regime bias: the sample contains a severe bear market (2022) and an AI-driven rally (2023-2024). Both skew the statistics.
- CFD data: USA30IDXUSD is a Dukascopy CFD, not the E-mini futures contract. Behaviour can differ around rollovers and gaps.
Methodology
- Source: M1 tick data (Dukascopy) for USA30IDXUSD between February 2012 and July 2026.
- Total: 4,190,807 M1 UTC candles, aggregated into 3,733 trading days and 174 months.
- Daily return: (close_22UTC[t] − close_22UTC[t−1]) / close_22UTC[t−1] × 100.
- Monthly return: (close_lastDay − close_lastDayPrevMonth) / close_lastDayPrevMonth × 100.
- Session drift: (close_last_bar − open_first_bar) / open × 100.
- Statistical test: one-sample t-test against zero. = p < 0.05.
- Software: Python 3.14, pandas 3.x, pyarrow, scipy, matplotlib.
For position sizes matched to Dow Jones volatility, use the position size calculator. For more on US indices, read strategies for US futures.
The full seasonality series
This study is part of a series applying the same methodology to six assets. The contrast between them is the most useful part: the index "Monday rally" simply does not exist in gold or the FX majors.
- NASDAQ-100 — the strongest Monday rally of the six (p=0.0001).
- XAUUSD (gold) — 23 years of data, best day Friday and best month January.
- XAGUSD (silver) — gold's more volatile sibling.
- EURUSD — the world's most traded pair, 23 years.
- GBPUSD — the London session and its intraday bias.