

Does EUR/USD have good days, good months and good hours? To answer with data, we downloaded 23 years of M1 tick data (8,681,978 candles between May 2003 and July 2026) and aggregated it by day of week, calendar month and trading session. Spoiler: EUR/USD is noisier than gold — no day nor month is statistically significant, but two sessions show clear biases.
The dataset
📊 The data behind this article, as tables and CSV: /stats/EURUSD publishes these same series (8,719,236 M1 bars) as a downloadable reference, plus the measured bid/ask spread hour by hour —0.5 points median—which this article does not cover. This article is the analysis, with its significance tests; that page is the raw numbers.
1. Seasonality by day of week
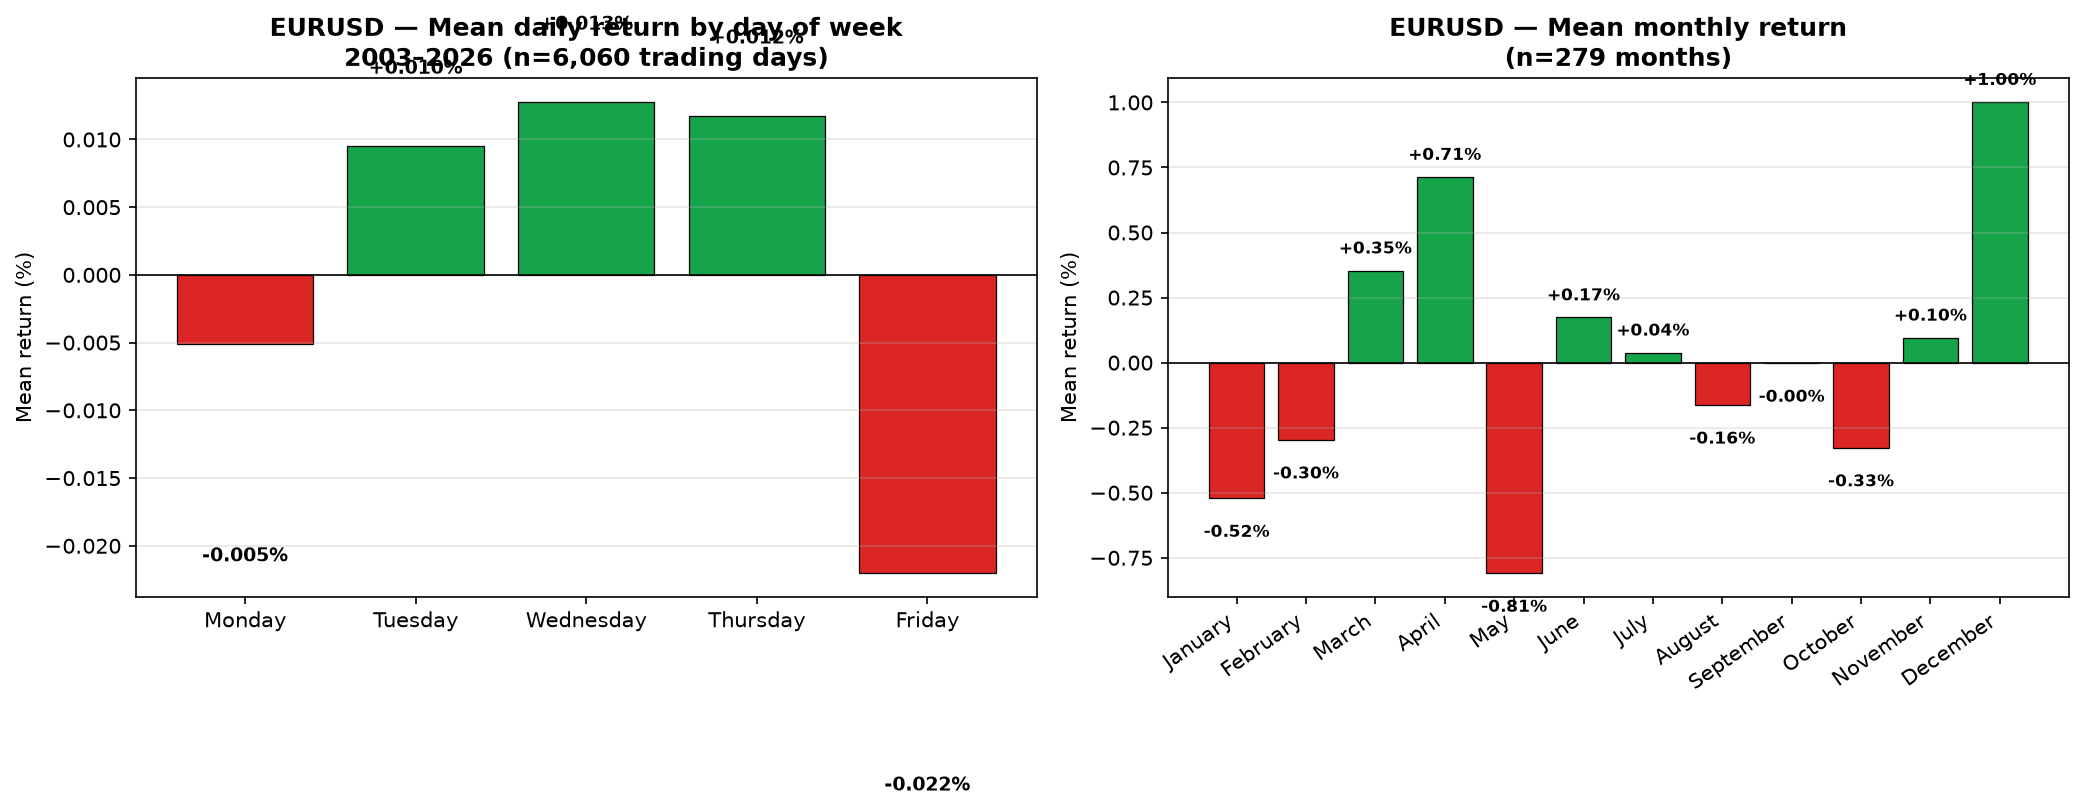
Each Monday-through-Friday trading day, close-to-close return in %. Statistical test: t-test vs zero. = p < 0.05.
| Day | n | Mean % | Median % | Std % | Win rate | t-stat | p-value |
|---|---|---|---|---|---|---|---|
| Monday | 1,213 | -0.0051% | -0.0027% | 0.4984% | 49.5% | -0.36 | 0.722 |
| Tuesday | 1,213 | +0.0095% | -0.0097% | 0.5576% | 49.5% | 0.59 | 0.552 |
| Wednesday | 1,212 | +0.0128% | +0.0131% | 0.5729% | 51.2% | 0.78 | 0.438 |
| Thursday | 1,212 | +0.0118% | -0.0049% | 0.5954% | 49.6% | 0.69 | 0.492 |
| Friday | 1,210 | -0.0220% | -0.0072% | 0.5758% | 49.3% | -1.33 | 0.184 |
Reading: EUR/USD shows no directional bias by day of week. None passes the 5% significance test. Wednesday and Thursday are slightly positive; Friday is borderline negative (-0.022%, p=0.18). Honest conclusion: for EUR/USD, day of week is statistical noise — not a useful filter.
2. Seasonality by month
| Month | n | Mean % | Median % | Std % | Win rate | t-stat | p-value |
|---|---|---|---|---|---|---|---|
| January | 23 | -0.521% | -0.286% | 2.980% | 43.5% | -0.84 | 0.411 |
| February | 23 | -0.296% | -0.267% | 1.607% | 43.5% | -0.88 | 0.386 |
| March | 23 | +0.354% | +0.007% | 2.464% | 52.2% | 0.69 | 0.498 |
| April | 23 | +0.714% | +0.631% | 2.503% | 52.2% | 1.37 | 0.185 |
| May | 23 | -0.809% | -0.684% | 3.175% | 37.5% | -1.22 | 0.235 |
| June | 24 | +0.174% | +0.144% | 1.673% | 54.2% | 0.51 | 0.615 |
| July | 24 | +0.038% | -0.087% | 2.446% | 50.0% | 0.08 | 0.939 |
| August | 23 | -0.162% | -0.098% | 1.942% | 47.8% | -0.40 | 0.692 |
| September | 23 | -0.002% | -0.478% | 3.315% | 47.8% | -0.00 | 0.998 |
| October | 23 | -0.327% | -0.150% | 2.703% | 47.8% | -0.58 | 0.568 |
| November | 23 | +0.096% | +0.080% | 3.013% | 56.5% | 0.15 | 0.880 |
| December | 23 | +1.002% | +1.246% | 3.007% | 69.6% | 1.60 | 0.124 |
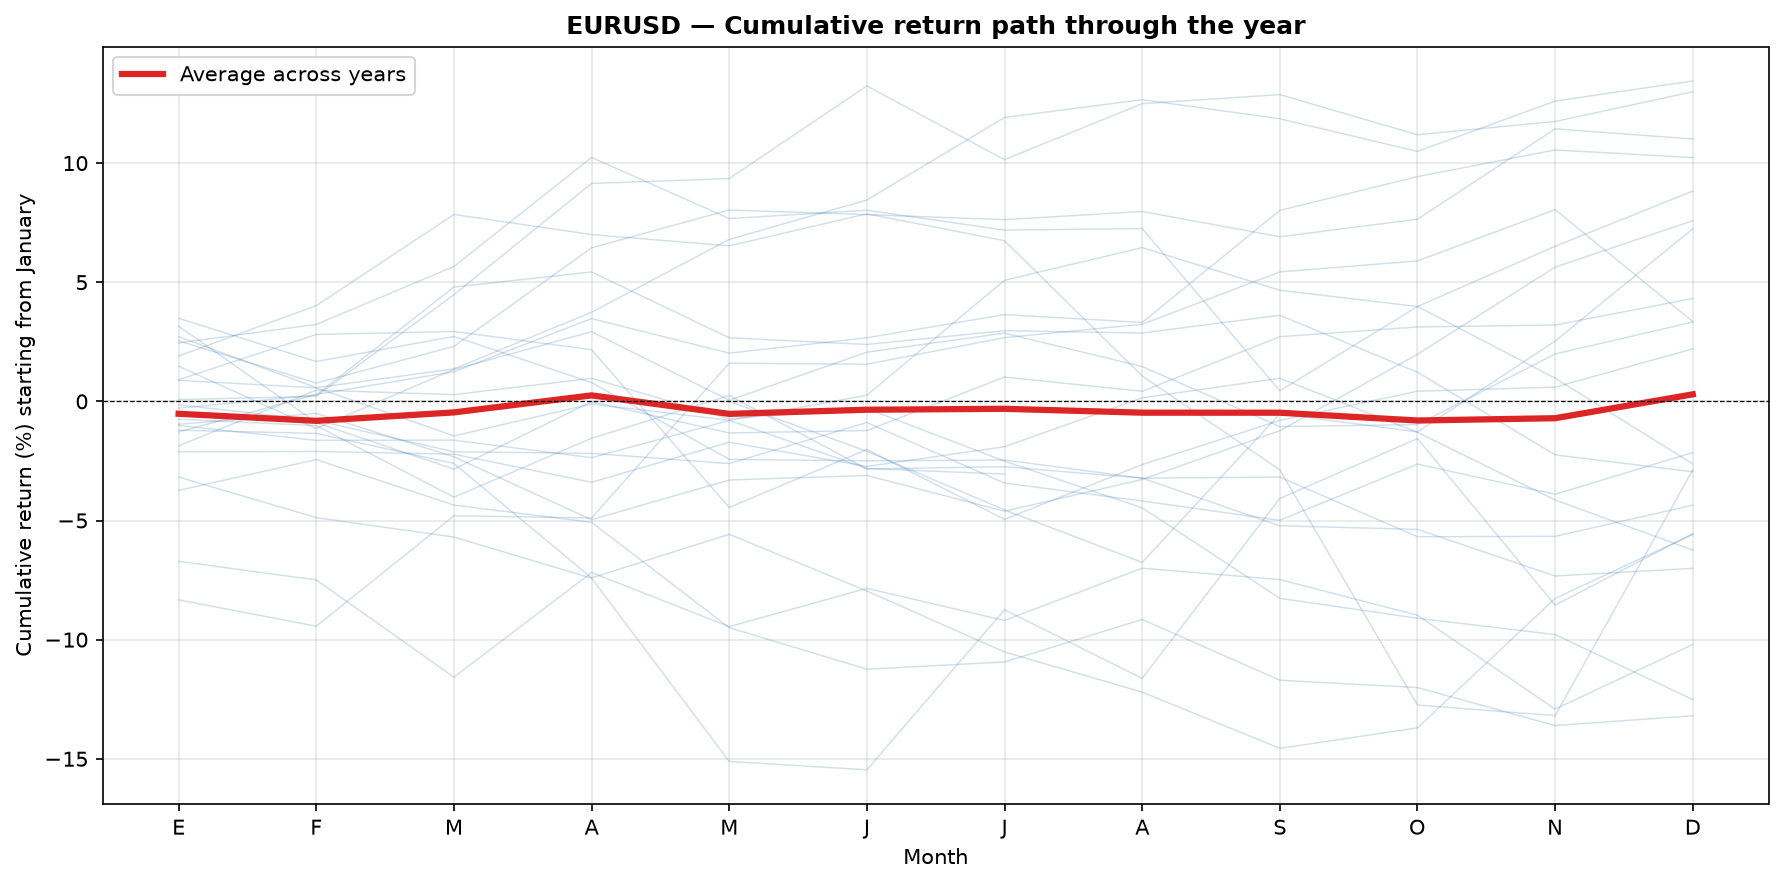
Reading: EUR/USD shows no significant monthly seasonality at 5%, but December stands out with +1.00% mean and 69.6% win rate (16 of 23 Decembers closed positive). The p-value (0.124) is above 5% but the win rate is notable — the "year-end rally" effect on EUR/USD is real but modest. May is the worst month (-0.81%, win 37.5%).
3. Seasonality by trading session (UTC)
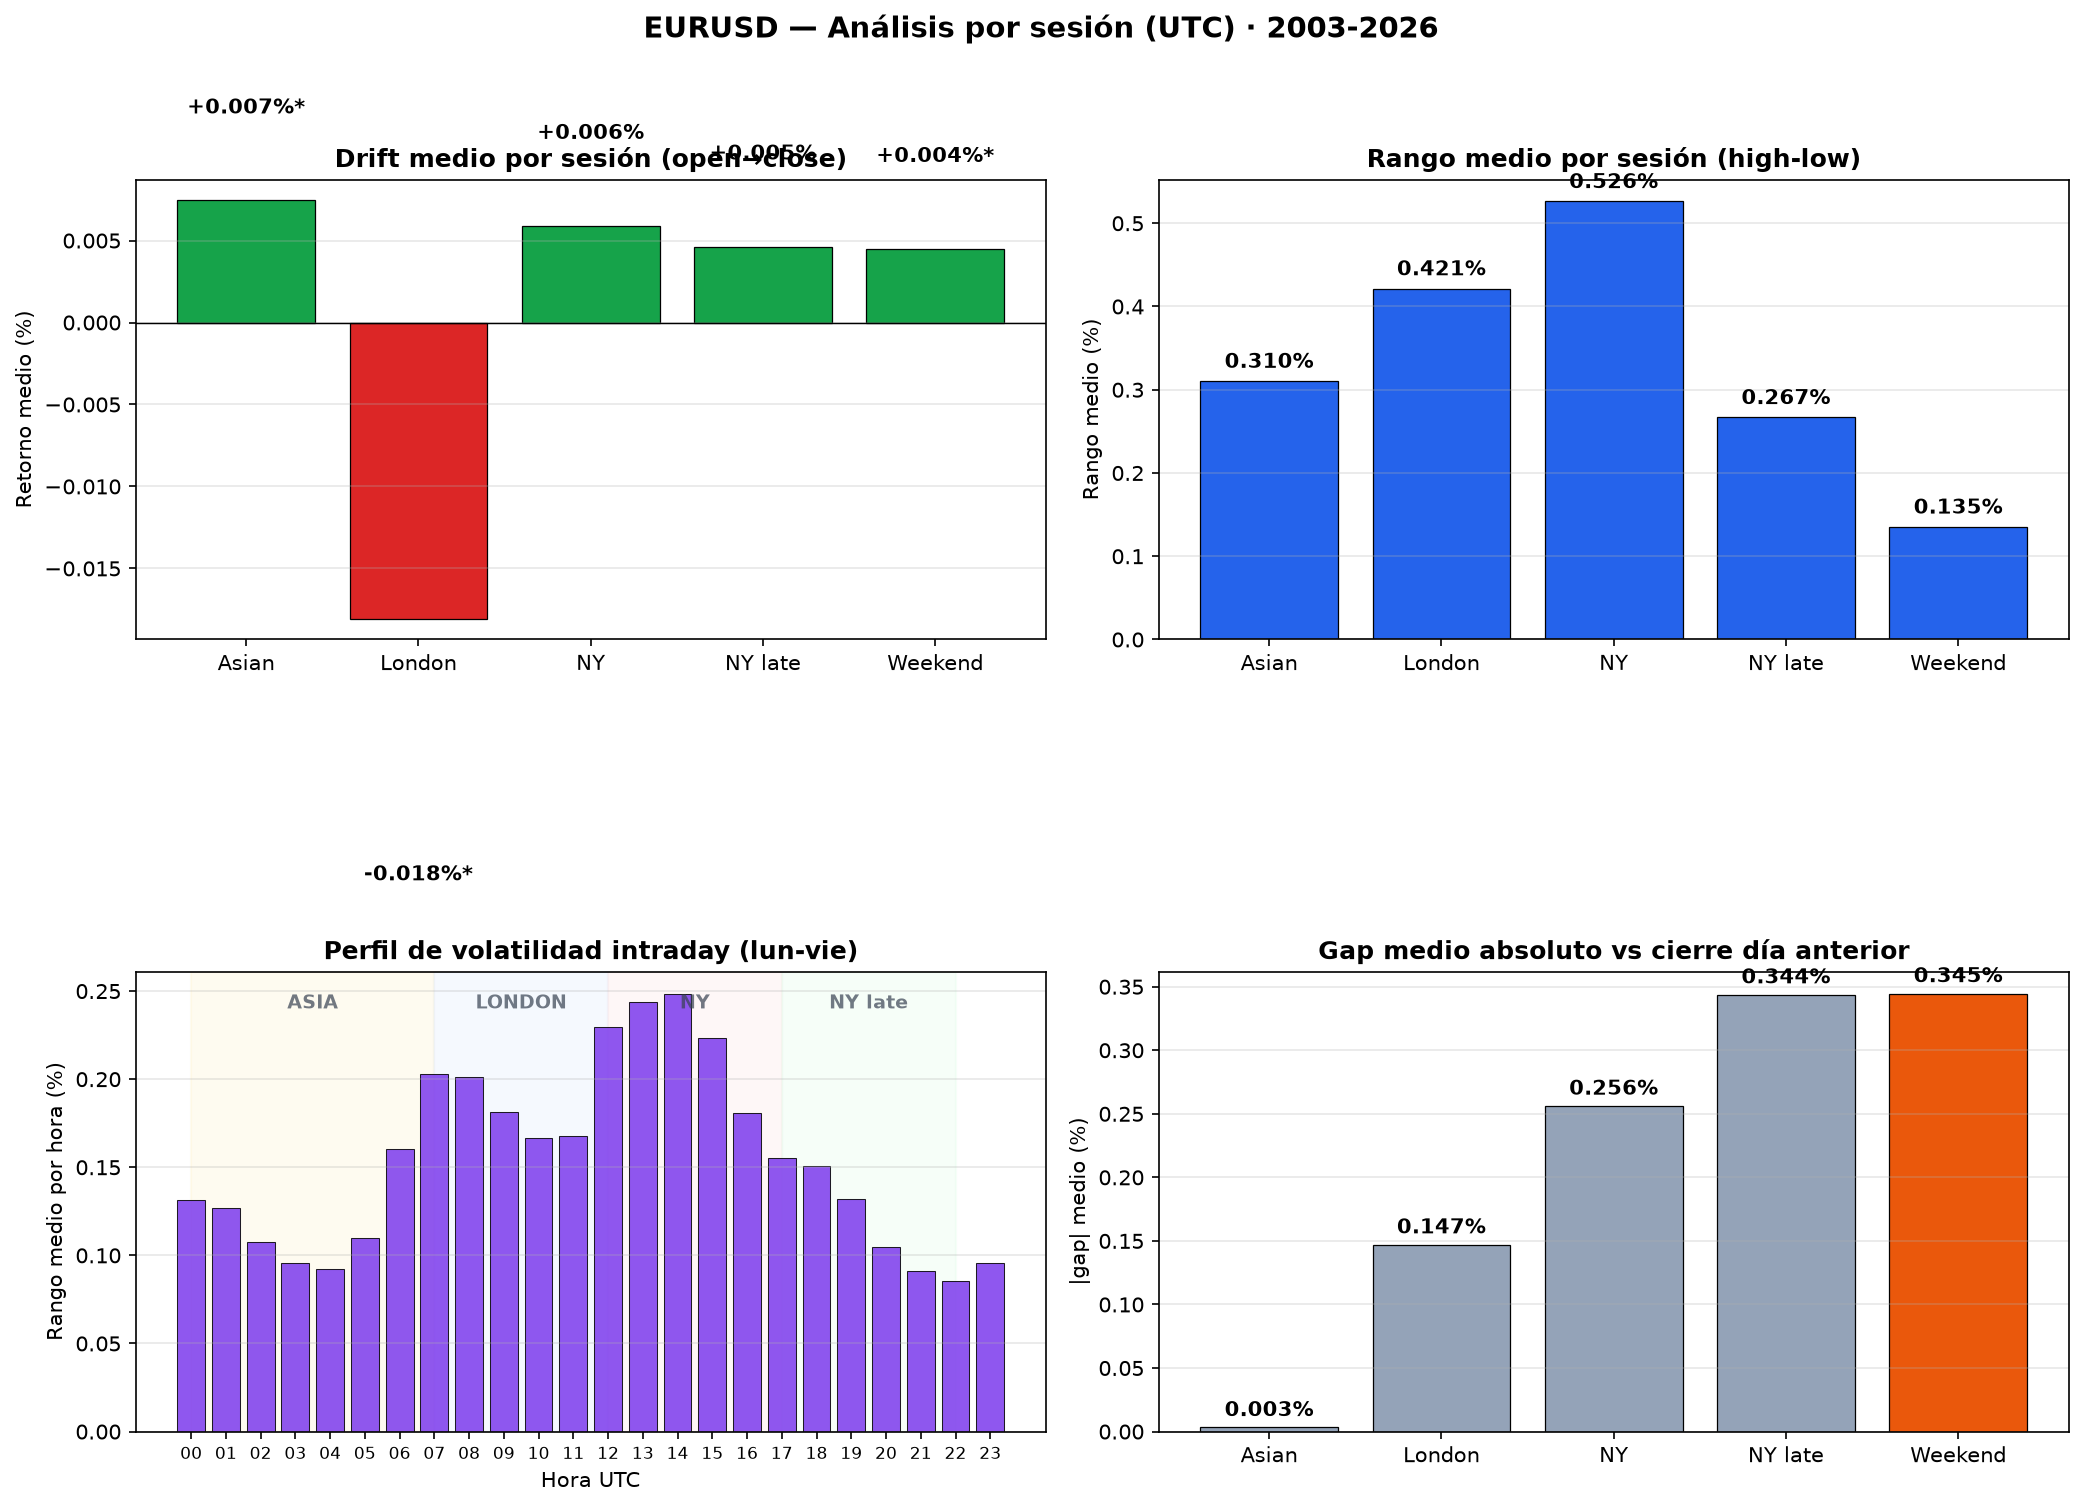
Here we find robust patterns. The five canonical forex sessions:
| Session | n | Mean drift % | Win rate | p-value | Mean range % | |Gap| % |
|---|---|---|---|---|---|---|
| Asian (00–07 UTC) | 6,052 | +0.0074% | 51.9% | 0.006 | 0.3103% | 0.0033% |
| London (07–12 UTC) | 6,051 | -0.0181% | 47.7% | <0.001 | 0.4215% | 0.1470% |
| NY (12–17 UTC) | 6,041 | +0.0059% | 50.5% | 0.207 | 0.5262% | 0.2561% |
| NY late (17–22 UTC) | 6,821 | +0.0046% | 50.8% | 0.058 | 0.2668% | 0.3437% |
| Weekend gap (22–24 UTC) | 6,050 | +0.0045% | 53.9% | <0.001 | 0.1352% | 0.3446% |
Surprising findings for EUR/USD:
- Asian is bullish and significant: +0.0074% drift, p=0.006. The euro tends to appreciate while Asia operates — likely demand for European bonds on Asian open.
- London is bearish and VERY significant: -0.0181%, p<0.001. EUR/USD tends to correct during European hours — opposite pattern to gold.
- NY has no clear drift: although most volatile (range 0.53%), no directional bias.
- Weekend gap bullish: +0.0045% with 53.9% win rate, p<0.001.
4. Heatmap: day × session
| Day | Asian (00–07) | London (07–12) | NY (12–17) | NY late (17–22) |
|---|---|---|---|---|
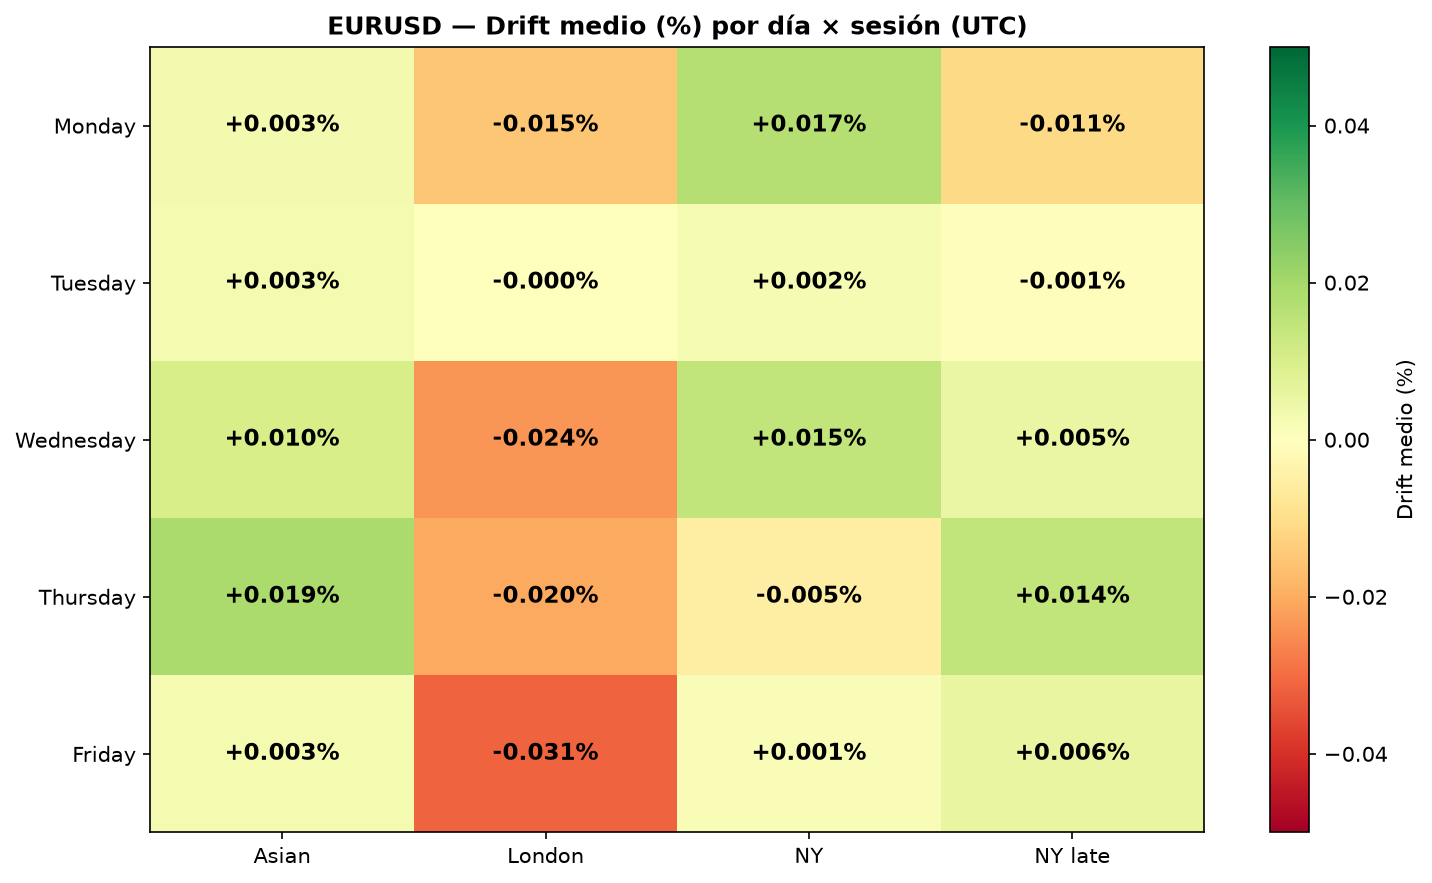
| Monday | +0.003% | -0.015% | +0.017% | -0.011% |
| Tuesday | +0.003% | -0.000% | +0.002% | -0.001% |
| Wednesday | +0.010% | -0.024% | +0.015% | +0.005% |
| Thursday | +0.019% | -0.020% | -0.005% | +0.014% |
| Friday | +0.003% | -0.031% | +0.001% | +0.006% |
Winning cells:
- 🥇 Thursday × Asian: +0.019% drift. Euro appreciates on Thursday Asian morning.
- 🥇 Wednesday × NY: +0.015% drift. Wednesday NY is bullish.
- 🔴 Friday × London: -0.031% drift. London opens Friday selling euros.
5. Top most volatile hours (UTC)
| Hour UTC | Mean range % | Std % | Session |
|---|---|---|---|
| 13:00 | 0.382% | 0.225 | NY open |
| 14:00 | 0.372% | 0.220 | London/NY |
| 12:00 | 0.313% | 0.201 | Pre-NY |
| 08:00 | 0.288% | 0.189 | London |
| 07:00 | 0.270% | 0.176 | London open |
| 15:00 | 0.265% | 0.184 | London/NY |
EUR/USD's hot window is 12:00–14:00 UTC (London-NY overlap): 0.31-0.38% mean range. London open is also active (07-08 UTC). Asian hours are 40-50% less volatile.
---6. Three practical setups for EUR/USD
Setup 1 · Short bias on Friday London
- When: Friday 07-12 UTC.
- Why: -0.031% drift, the most negative cell in the heatmap. Combined with London's general negative drift (-0.018%, p<0.001), Friday Europe is EUR/USD's most bearish window.
- Filter: combine with short-term momentum. Avoid without macro catalyst.
Setup 2 · Long bias on Thursday Asian
- When: Thursday 00-07 UTC.
- Why: +0.019% drift, the most positive cell. Asian session has aggregate significance (+0.007%, p=0.006), and Thursday is even stronger.
- Application: "Thursday morning Asian" is for EUR/USD what "Friday Asian" is for gold.
Setup 3 · Avoid London on every day
- When: Monday to Friday, 07-12 UTC.
- Why: London shows negative drift on 4 of 5 days. It's the window where EUR/USD tends to correct.
- Application: if your EA opens longs in London, it's in the worst window. Reorient trading hours to NY or Asian.
What this data does NOT tell you
- EUR/USD is noisier than gold: daily std ~0.5% vs gold's ~1%, but expected returns are also lower. Risk/drift ratio is worse.
- No robust monthly seasonality: only December has high win rate (69.6%) but p=0.124 doesn't reach 5%. Be careful overinterpreting bullish December.
- Transaction costs: typical retail spread is 0.5-1.5 pips (0.005-0.015%), which eats the entire Asian drift.
- DST ignored: sessions are fixed UTC buckets. London opens 07:00 UTC in summer, 08:00 in winter.
- Synthetic vs real data: this sample uses Dukascopy CFD/synthetic. Behaviour may differ from interbank EUR/USD, especially at ECB/Fed events.
Methodology
- Source: M1 tick data (Dukascopy) for EURUSD between May 2003 and July 2026.
- Total: 8,681,978 M1 UTC candles, aggregated into 6,060 trading days and 279 months.
- Daily return: (close_22UTC[t] - close_22UTC[t-1]) / close_22UTC[t-1] × 100.
- Monthly return: (close_lastDay - close_lastDayPrevMonth) / close_lastDayPrevMonth × 100.
- Session drift: (close_last_bar - open_first_bar) / open × 100.
- Statistical test: one-sample t-test vs zero. = p < 0.05.
- Software: Python 3.14, pandas 3.x, pyarrow, scipy, matplotlib. Reproducible scripts in
~/Documents/Obsidian/OC/research/seasonality/.
For volatility-adjusted lot sizes on EUR/USD, use the position size calculator. For more on the pair, read how to automate EUR/USD on MT5.
The full seasonality series
This study is part of a series applying the same methodology to six assets. The contrast between them is the most useful part: the index "Monday rally" does not exist in gold or the FX majors.
- XAUUSD (gold) — 23 years, best day Friday and best month January.
- GBPUSD — the London session and its intraday bias.
- XAGUSD (silver) — gold's more volatile sibling.
- Dow Jones (USA30) — the index "Monday rally".
- NASDAQ-100 — the strongest Monday of the six (p=0.0001).