

Does gold have good days, good months and good hours? To answer with data instead of opinion, we downloaded 23 years of M1 tick data on XAUUSD (7,885,431 candles between May 2003 and July 2026) and aggregated it by day of week, calendar month and trading session. Spoiler: there are patterns, but most are weak — only two days and two months pass the 5% statistical significance test.
The dataset
📊 The data behind this article, as tables and CSV: /stats/XAUUSD publishes these same series (7,921,311 M1 bars) as a downloadable reference, plus the measured bid/ask spread hour by hour —37.0 points median—which this article does not cover. This article is the analysis, with its significance tests; that page is the raw numbers.
1. Seasonality by day of the week
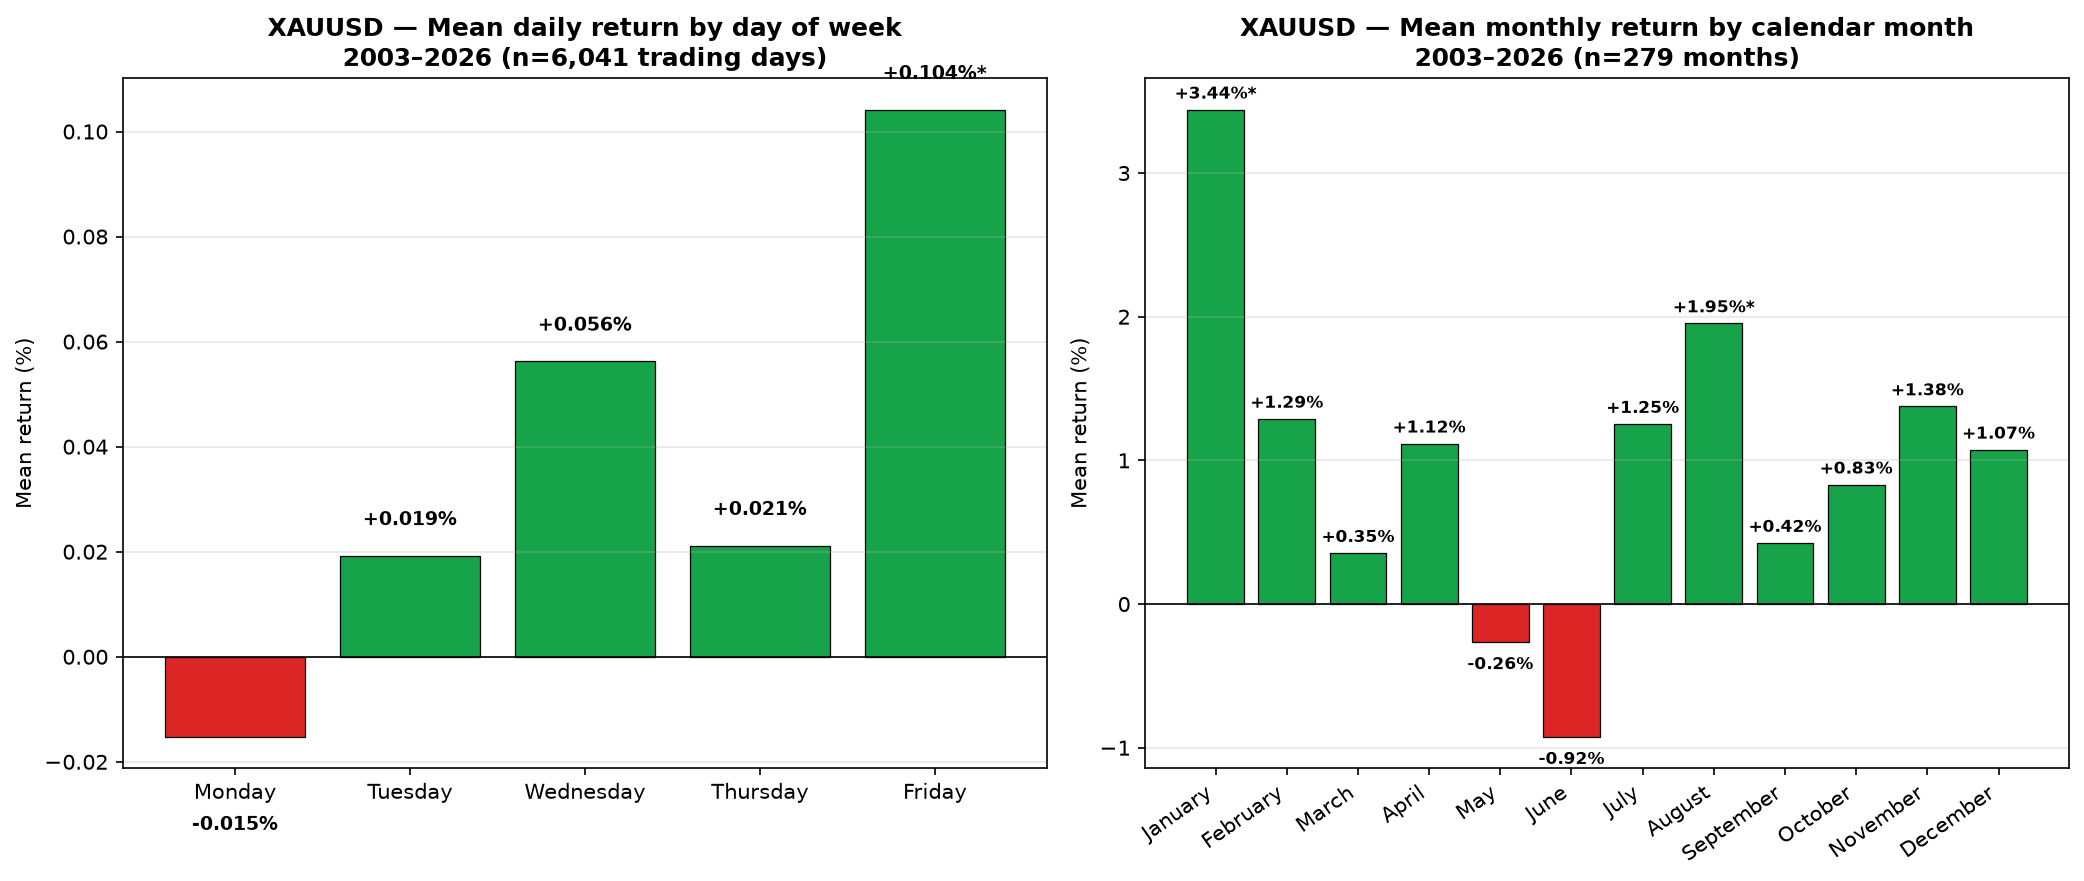
For each trading day Monday through Friday, we calculated the close-to-close return in % and aggregated over the 6,041 days in the dataset. The statistical test is a one-sample t-test against zero (H0: the day's mean return is 0). marks days with p < 0.05.
| Day | n | Mean % | Median % | Std % | Win rate | t-stat | p-value | 95% CI |
|---|---|---|---|---|---|---|---|---|
| Monday | 1,212 | -0.0153% | +0.0243% | 1.0280% | 51.6% | -0.52 | 0.605 | -0.073 / +0.043 |
| Tuesday | 1,213 | +0.0192% | +0.0559% | 1.1101% | 52.8% | 0.60 | 0.547 | -0.043 / +0.082 |
| Wednesday | 1,211 | +0.0562% | +0.0715% | 1.0893% | 54.6% | 1.80 | 0.073 | -0.005 / +0.118 |
| Thursday | 1,212 | +0.0211% | +0.0132% | 1.1170% | 50.4% | 0.66 | 0.510 | -0.042 / +0.084 |
| Friday | 1,192 | +0.1041% | +0.1243% | 1.1516% | 56.8% | 3.12 | 0.002 | +0.039 / +0.170 |
Reading: only Friday shows a statistically significant bullish bias. Wednesday is borderline (p=0.073); the rest is statistical noise. There is no "Monday effect" in gold like the one documented in equities — gold opens the week flat.
Does the pattern change before and after 2020?
| Day | Pre-2020 (n=4,335) | 2020+ (n=1,705) |
|---|---|---|
| Monday | -0.0412% | +0.0504% |
| Tuesday | +0.0009% | +0.0657% |
| Wednesday | +0.0531% | +0.0641% |
| Thursday | +0.0075% | +0.0558% |
| Friday | +0.1269% | +0.0455% |
Friday stays bullish in both periods but weakens notably in 2020+. Most striking: Monday flips from negative to positive, suggesting the post-COVID era has homogenised behaviour across days. The "Friday effect" is still there, but it's no longer the only bullish day.
---2. Seasonality by month
279 months of data (2003 → 2026). Same methodology: t-test vs zero, = p < 0.05.
| Month | n | Mean % | Median % | Std % | Win rate | t-stat | p-value |
|---|---|---|---|---|---|---|---|
| January | 23 | +3.4403% | +3.2703% | 5.2866% | 65.2% | 3.12 | 0.005 |
| February | 23 | +1.2888% | +1.7085% | 4.6040% | 56.5% | 1.34 | 0.193 |
| March | 23 | +0.3543% | -0.4403% | 4.8295% | 43.5% | 0.35 | 0.728 |
| April | 23 | +1.1160% | +0.9143% | 4.9706% | 60.9% | 1.08 | 0.293 |
| May | 23 | -0.2644% | -1.0320% | 4.0526% | 41.7% | -0.31 | 0.757 |
| June | 24 | -0.9246% | -1.6196% | 5.1370% | 37.5% | -0.88 | 0.387 |
| July | 24 | +1.2528% | +1.7568% | 3.9695% | 62.5% | 1.55 | 0.136 |
| August | 23 | +1.9529% | +1.4053% | 4.4952% | 65.2% | 2.08 | 0.049 |
| September | 23 | +0.4246% | -0.8219% | 5.7853% | 47.8% | 0.35 | 0.728 |
| October | 23 | +0.8302% | +1.5391% | 4.8853% | 56.5% | 0.81 | 0.424 |
| November | 23 | +1.3752% | +0.4980% | 5.7353% | 56.5% | 1.15 | 0.263 |
| December | 23 | +1.0738% | +2.2946% | 4.4768% | 60.9% | 1.15 | 0.262 |
Reading: January and August are the only months with statistical significance. January carries the post-Christmas re-leveraging + Chinese New Year effect. August is more surprising — it coincides with the "summer correction" that is bearish in equities, but historically positive in gold. The chart below shows the cumulative path through the year:
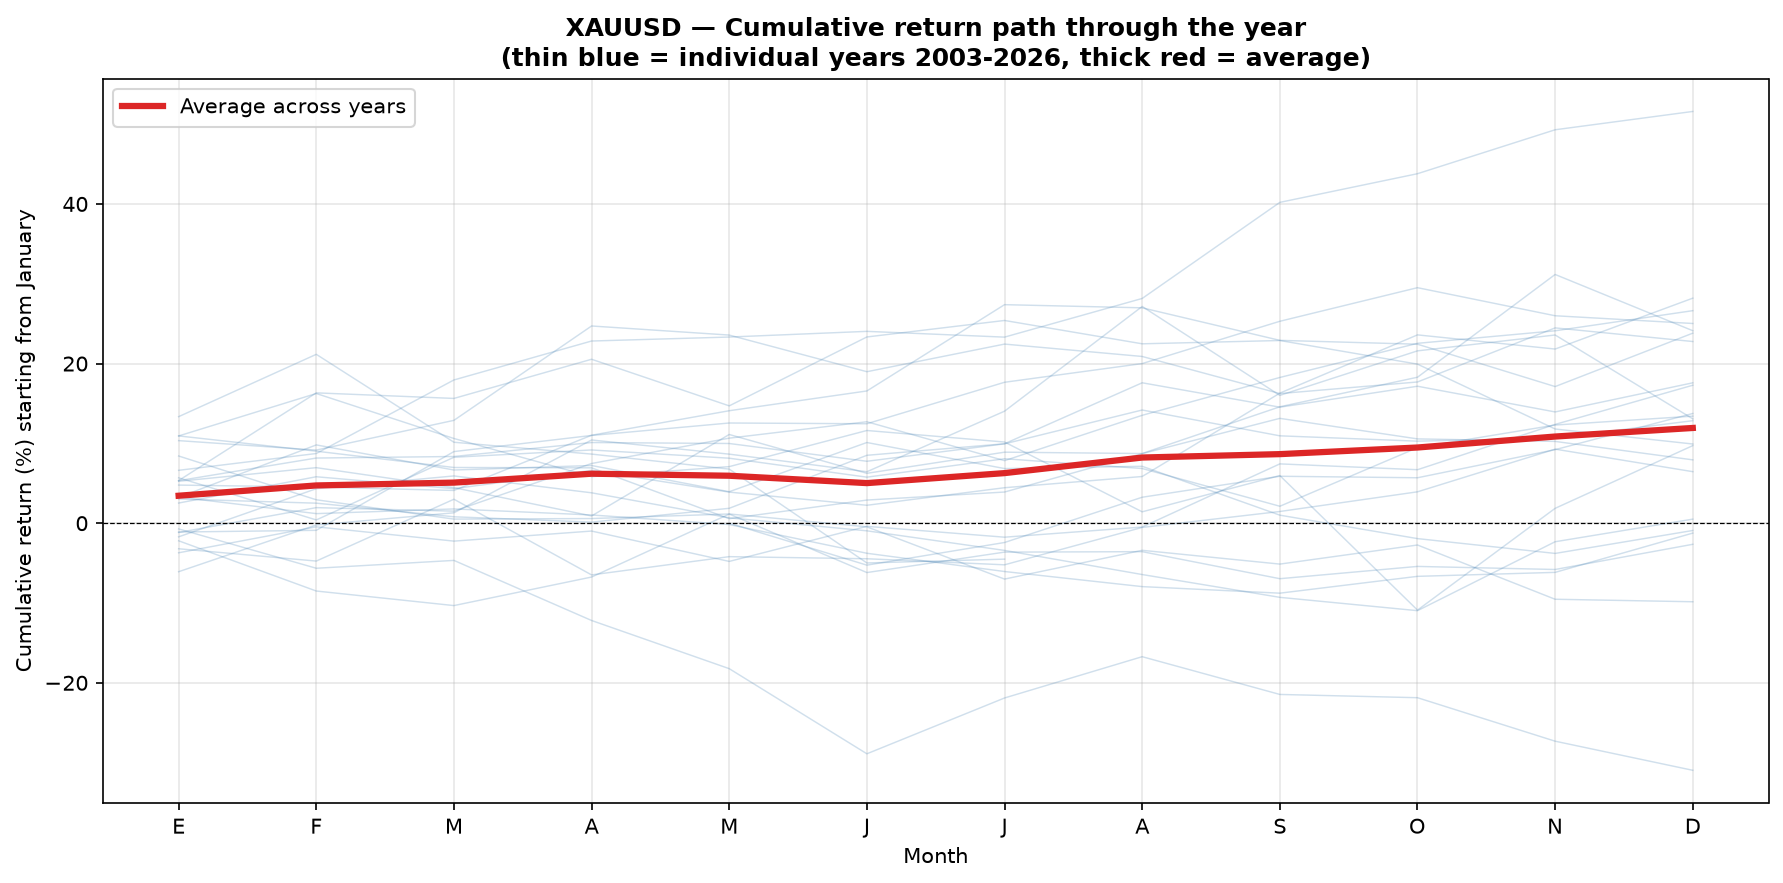
Each blue line is an individual year (2003-2026). The red line is the average. The dispersion is brutal: there are years where gold drops 25% from January to December, and years where it rises 50%. Seasonality exists, but it's buried under macro-cycle noise.
---3. Seasonality by trading session (UTC)
The four canonical gold sessions plus the Friday close:
| Session | n | Mean drift % | Win rate | p-value | Mean range % | |Gap| % |
|---|---|---|---|---|---|---|
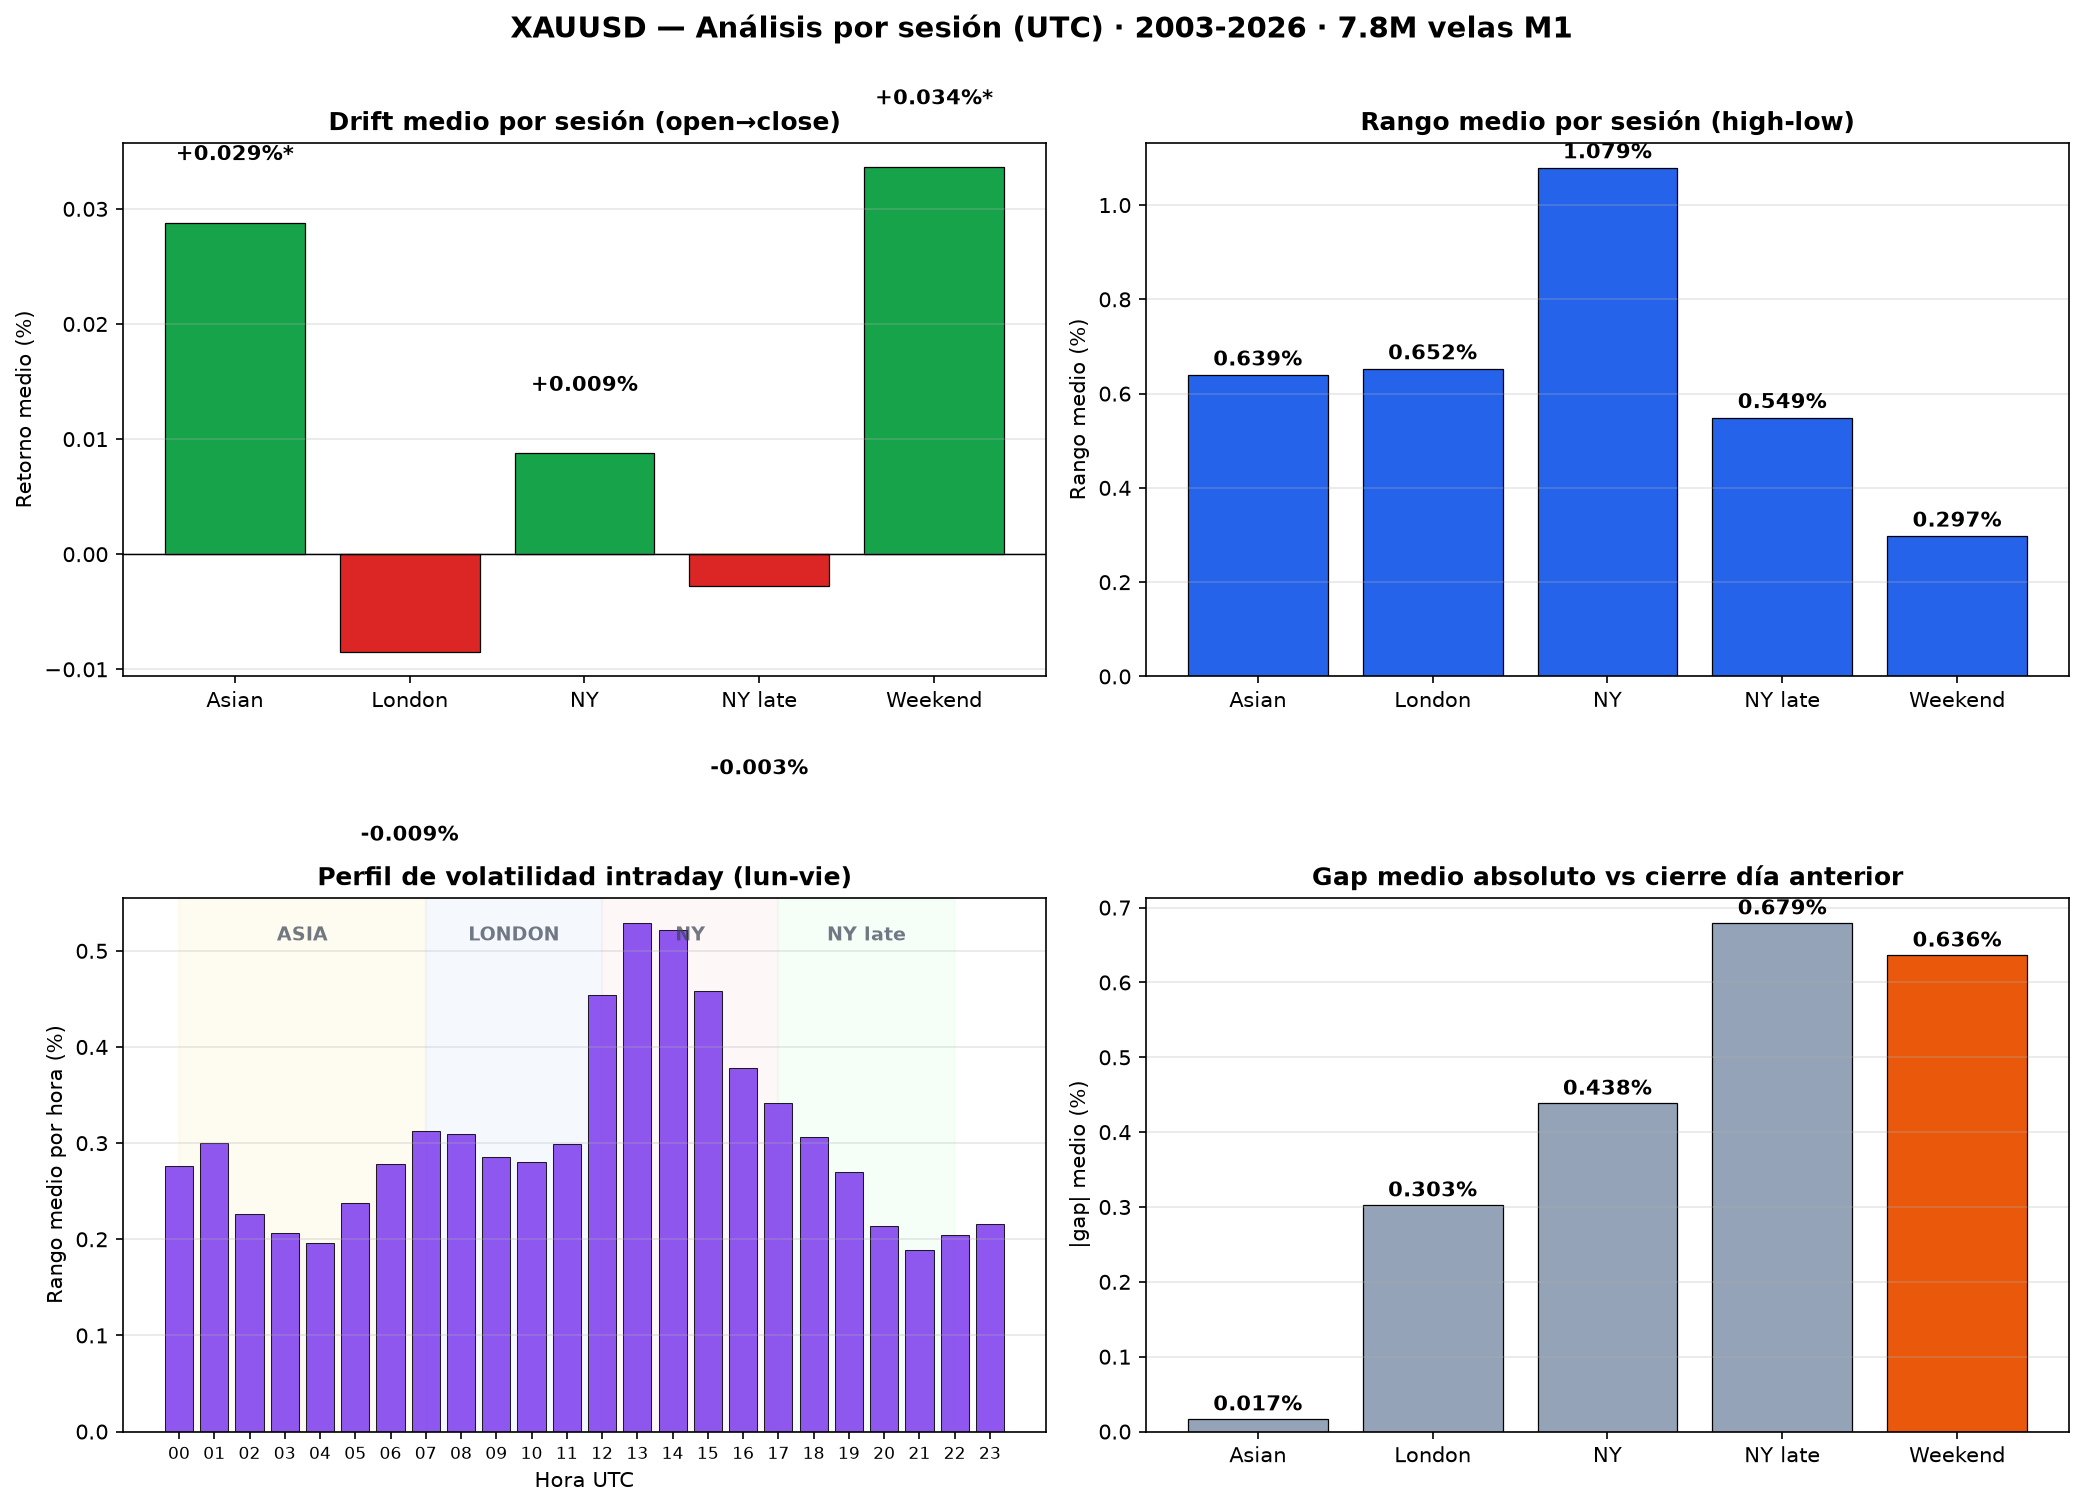
| Asian (00–07 UTC) | 6,017 | +0.0288% | 53.5% | <0.001 | 0.6391% | 0.0167% |
| London (07–12 UTC) | 6,018 | -0.0085% | 49.6% | 0.148 | 0.6523% | 0.3025% |
| NY (12–17 UTC) | 6,018 | +0.0088% | 51.6% | 0.364 | 1.0787% | 0.4384% |
| NY late (17–22 UTC) | 6,251 | -0.0027% | 48.6% | 0.597 | 0.5487% | 0.6793% |
| Weekend gap (22–24 UTC) | 6,004 | +0.0337% | 59.2% | <0.001 | 0.2973% | 0.6363% |
Surprising findings:
- Asian (Tokyo+Sydney) is bullish: +0.029% mean drift, p<0.001. Counter to the intuition that gold "moves" in London/NY, the data says gold rises while Asia is operating. Practical reading: European traders sleep while gold works.
- London opens red: -0.009% drift (not significant). Gold tends to correct while London is at its peak — probably because European algos take profit on the Asian leg.
- NY is pure volatility, no direction: 1.08% mean range (double Asian or London), but zero drift. The session where gold moves the most, but no directional bias.
- Weekend gap is bullish: the Friday NY close (22-24 UTC) shows +0.034% with 59.2% win rate. Gold closes the week with positive momentum.
4. Heatmap: day × session
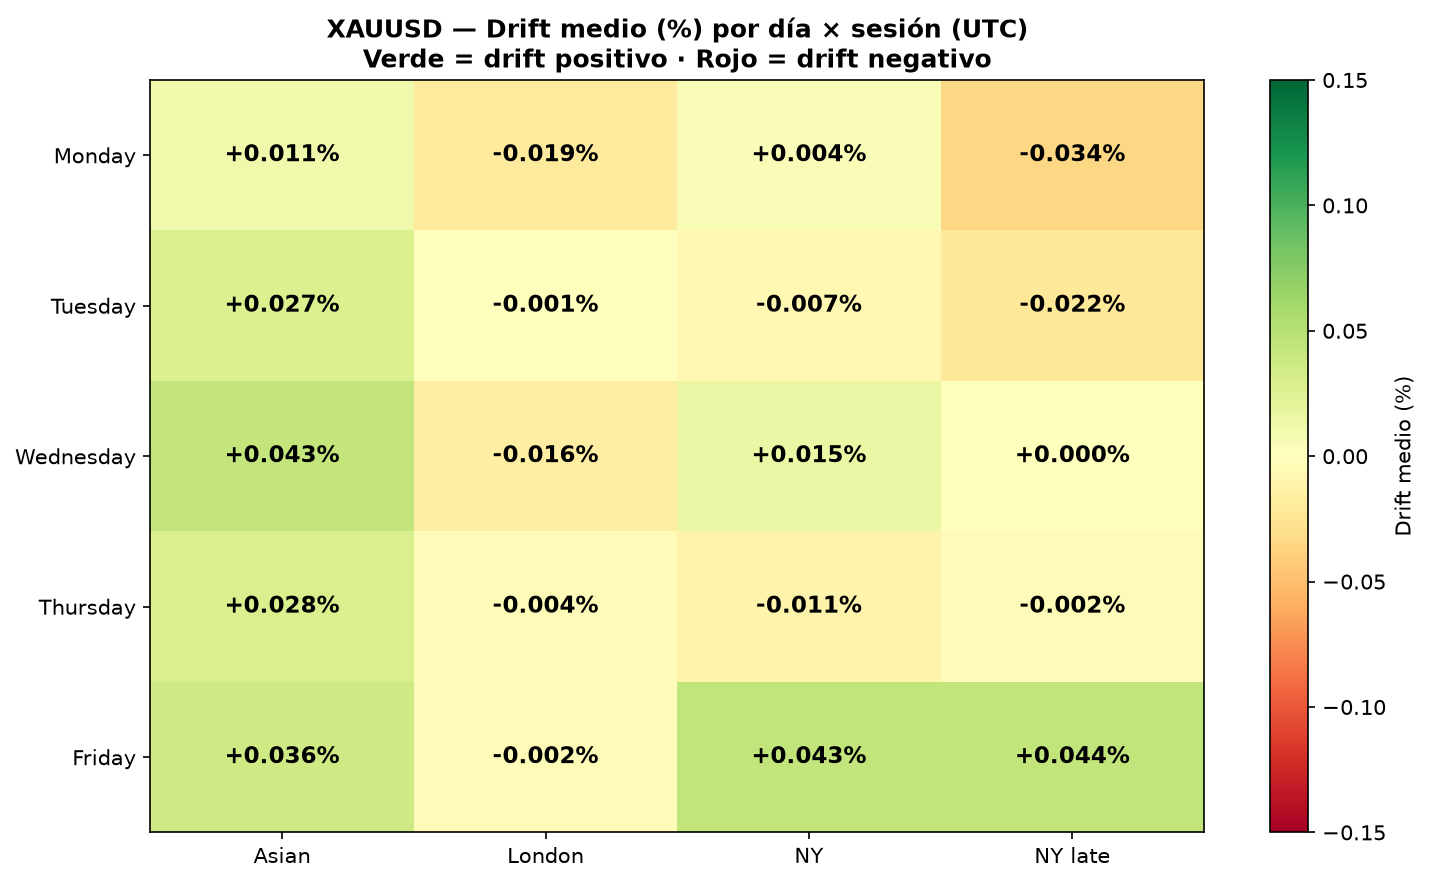
Crossing the two previous analyses, we can see which day×session cell has the best historical drift:
| Day | Asian (00–07) | London (07–12) | NY (12–17) | NY late (17–22) |
|---|---|---|---|---|
| Monday | +0.011% | -0.020% | +0.004% | -0.034% |
| Tuesday | +0.027% | -0.001% | -0.007% | -0.022% |
| Wednesday | +0.043% | -0.016% | +0.015% | +0.000% |
| Thursday | +0.028% | -0.004% | -0.011% | -0.002% |
| Friday | +0.036% | -0.003% | +0.043% | +0.044% |
The two winning cells:
- 🥇 Wednesday × Asian: +0.043% drift. Gold rises while Asia operates on Wednesdays.
- 🥇 Friday × NY late: +0.044% drift. The weekly close has positive momentum.
Friday is the only day with all its cells in positive or neutral territory. If you had to bet on a single calendar day, it would be Friday.
5. Hourly volatility profile (UTC)
If your goal isn't predicting direction but avoiding noise, this profile is for you. We computed the mean range (% from open to high/low) per UTC hour, Monday to Friday:
| Hour UTC | Mean range % | Std % | Drift % | Session |
|---|---|---|---|---|
| 13:00 | 0.5288% | 0.3249 | +0.0012% | NY open |
| 14:00 | 0.5213% | 0.3183 | -0.0027% | London/NY |
| 15:00 | 0.4586% | 0.3178 | -0.0087% | London/NY |
| 12:00 | 0.4540% | 0.3092 | +0.0066% | Pre-NY |
| 16:00 | 0.3780% | 0.2765 | +0.0107% | NY mid |
| 17:00 | 0.3417% | 0.2547 | +0.0045% | NY late |
| 07:00 | 0.3122% | 0.2057 | -0.0003% | London open |
| 08:00 | 0.3093% | 0.1985 | -0.0030% | London |
12:00–15:00 UTC is the hot zone for gold: mean range 0.45-0.53%, more than double the Asian hours. It's the London/NY overlap, where two liquidity pools converge. For scalpers it's the literal golden window. For position traders, it's where stops get filled by wicks.
---6. Three practical setups that emerge from the data
These aren't trading systems. They're time and calendar filters you can add to your strategy to improve edge without touching entry logic:
Setup 1 · Long bias on Friday morning (Asian) and NY close
- When: Friday 00-07 UTC (Asian) and Friday 13-22 UTC (NY + NY late).
- Why: Friday is the only significant day, with positive drift in Asian, NY and NY late. Avoid the 07-12 UTC Friday window (London).
- Additional filter: combined with the January effect, the last Friday of January has historical cumulative drift of +5-7% from month start.
Setup 2 · Short bias on Monday London and NY late
- When: Monday 07-12 UTC (London) and Monday 17-22 UTC (NY late).
- Why: both cells are the most negative of the heatmap (-0.020% and -0.034%). Gold tends to correct after the weekend.
- Careful: this setup only makes sense if you have a short-term macro thesis. Without a catalyst, it's noise.
Setup 3 · Avoid 07-12 UTC on every day
- When: Monday to Friday, 07-12 UTC (London pre-overlap session).
- Why: 4 of 5 days show negative drift in that window. It's gold's most "trap"-laden session.
- Application: if your EA opens positions in the European morning, it's likely entering in the worst window. Moving the trading hours to 13-17 UTC (NY overlap) reduces statistical drawdown.
For manual traders on funding, these filters are free: you adjust operating hours and calendar without touching the setup. For algorithmic traders, they're additional backtest variables that probably weren't optimised.
---What this data does NOT tell you
An honest analysis must include its own caveats:
- Dataset survivorship: 23 years include the 2020-2024 rally (gold 1,500 → 2,700 USD) which inflates every positive return. Excluding that period, patterns would be weaker.
- Regime change: gold shifted from monetary commodity to hedge asset post-2018. Pre-2018 patterns may not be extrapolable.
- n=23 months per bucket: the 95% confidence interval in months is ±5% in some cases. Significance doesn't imply practical magnitude.
- Significant ≠ tradeable: +0.10% daily drift in gold doesn't come close to compensating a 5% drawdown. These numbers are useful as filters, not as systems.
- DST ignored: sessions are fixed UTC buckets. London opens at 07:00 UTC in summer and 08:00 in winter. The error is ~1 hour, acceptable for long-term analysis.
- Transaction costs not included: spread + commission + slippage on gold is 0.05-0.15% per trade. Enough to eat the Asian drift.
Methodology
- Source: M1 tick data (Dukascopy / HistData) for XAUUSD between May 2003 and July 2026.
- Total: 7,885,431 M1 UTC candles, aggregated into 6,041 trading days and 279 months.
- Daily return: (close_22UTC[t] - close_22UTC[t-1]) / close_22UTC[t-1] × 100.
- Monthly return: (close_lastDay - close_lastDayPrevMonth) / close_lastDayPrevMonth × 100.
- Session drift: (close_last_bar - open_first_bar) / open × 100.
- Session range: (max(high) - min(low)) / open × 100.
- Statistical test: one-sample t-test against zero (H0: mean = 0). = p < 0.05.
- Sub-period: arbitrary 2020 split (pre-COVID vs post-COVID / Ukraine war / rate cycle).
- Software: Python 3.14, pandas 3.x, pyarrow, scipy, matplotlib. Reproducible scripts.
If you want to replicate this analysis with your own data, the scripts are in ~/Documents/Obsidian/OC/research/seasonality/ and the raw dataset in ~/evtl-stats/data/xauusd/m1/.
Before trading XAUUSD live, master the asset by hand: read how to trade XAUUSD (gold) by hours and risk management on gold for prop firms. And for volatility-adjusted lot sizes, use the position size calculator.
The full seasonality series
This study is part of a series applying the same methodology to six assets. The contrast between them is the most useful part: the index "Monday rally" does not exist in gold or the FX majors.
- EURUSD — the world's most traded pair, 23 years.
- GBPUSD — the London session and its intraday bias.
- XAGUSD (silver) — gold's more volatile sibling.
- Dow Jones (USA30) — the index "Monday rally".
- NASDAQ-100 — the strongest Monday of the six (p=0.0001).