

Does GBP/USD have good days, good months and good hours? To answer with data, we downloaded 23 years of M1 tick data (8,678,561 candles between May 2003 and July 2026) and aggregated it by day of week, calendar month and trading session. Spoiler: GBP/USD has stronger findings than EUR/USD — Friday and London Monday are the key day/session combos.
The dataset
📊 The data behind this article, as tables and CSV: /stats/GBPUSD publishes these same series (8,715,844 M1 bars) as a downloadable reference, plus the measured bid/ask spread hour by hour —1.1 points median—which this article does not cover. This article is the analysis, with its significance tests; that page is the raw numbers.
1. Seasonality by day of week
| Day | n | Mean % | Median % | Std % | Win rate | t-stat | p-value |
|---|---|---|---|---|---|---|---|
| Monday | 1,213 | -0.0017% | 0.0000% | 0.5224% | 50.0% | -0.11 | 0.910 |
| Tuesday | 1,213 | +0.0143% | +0.0016% | 0.5883% | 50.1% | 0.85 | 0.398 |
| Wednesday | 1,212 | +0.0151% | +0.0110% | 0.5721% | 51.1% | 0.92 | 0.360 |
| Thursday | 1,212 | +0.0129% | +0.0009% | 0.5942% | 50.1% | 0.76 | 0.449 |
| Friday | 1,210 | -0.0452% | -0.0216% | 0.5893% | 47.9% | -2.67 | 0.008 |
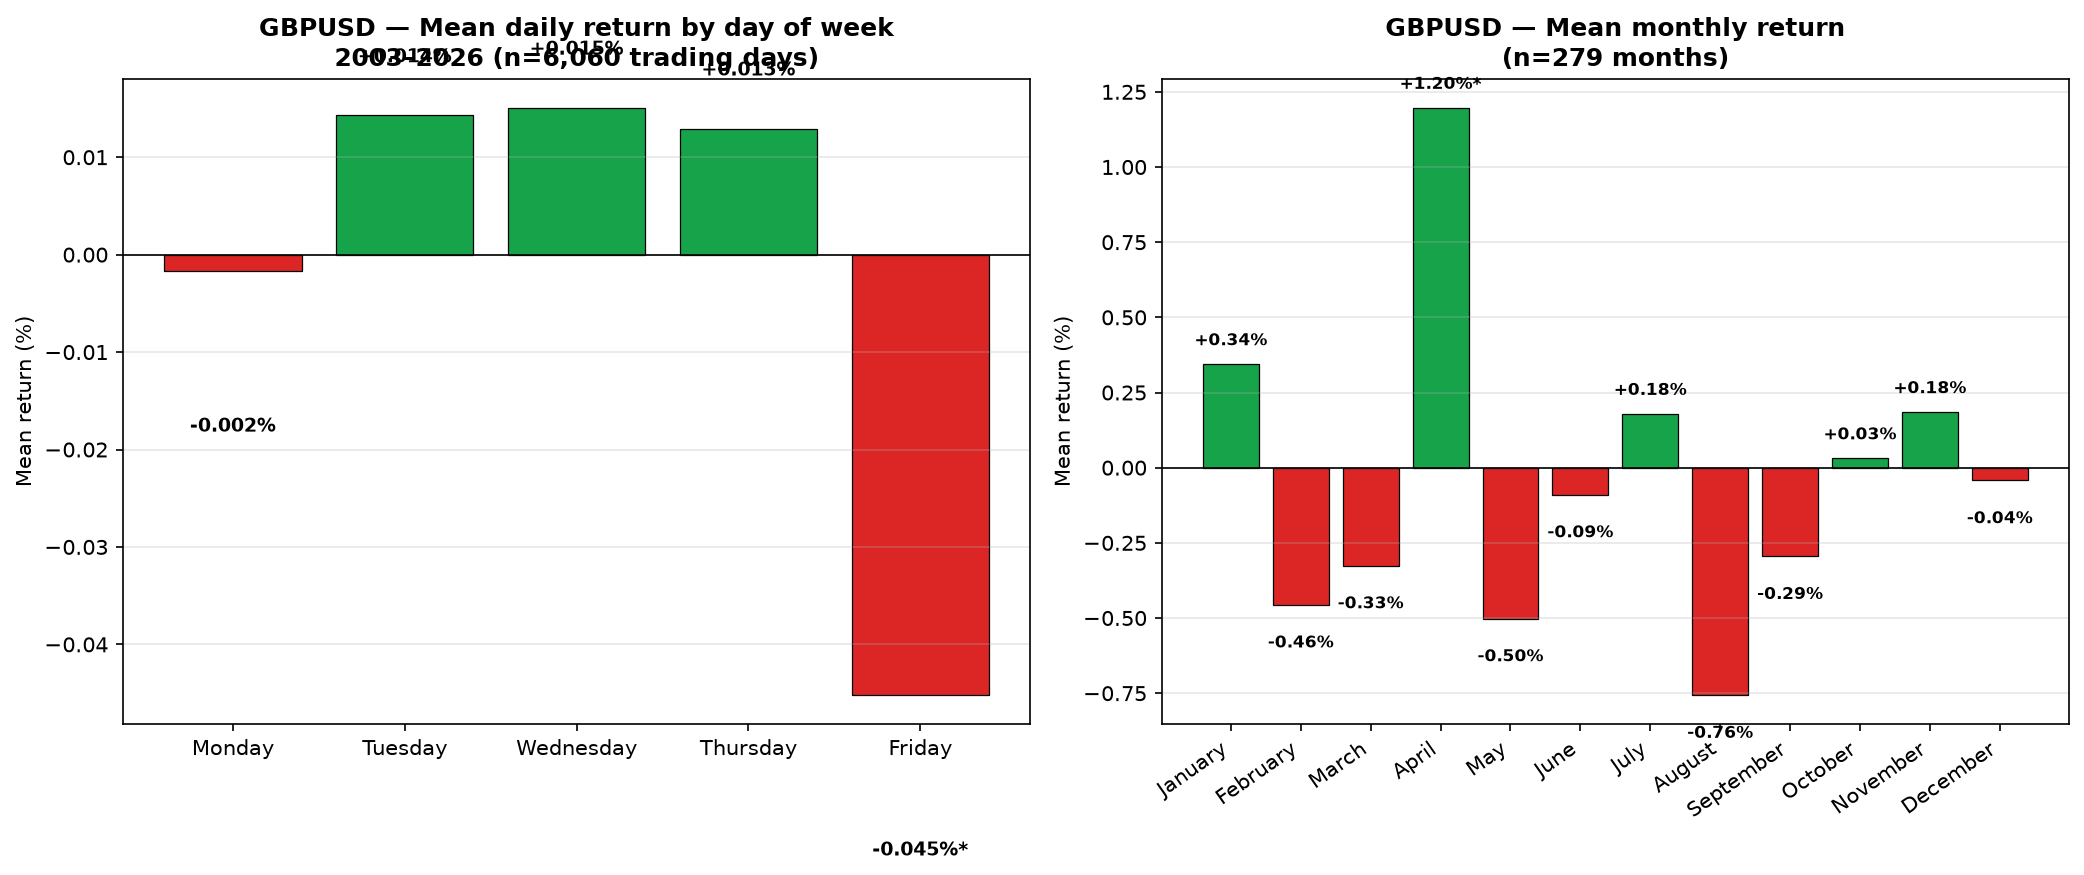
Clear finding for GBP/USD: Friday is bearish and significant (-0.045% mean, 47.9% win rate, p=0.008). Sterling loses on Fridays with regularity. The rest of days are statistical noise, though Wednesday and Thursday are slightly positive.
2. Seasonality by month
| Month | n | Mean % | Median % | Std % | Win rate | t-stat | p-value |
|---|---|---|---|---|---|---|---|
| January | 23 | +0.344% | +0.215% | 2.135% | 52.2% | 0.77 | 0.448 |
| February | 23 | -0.456% | -0.167% | 2.225% | 43.5% | -0.98 | 0.337 |
| March | 23 | -0.326% | -0.298% | 1.832% | 47.8% | -0.85 | 0.403 |
| April | 23 | +1.197% | +1.417% | 2.288% | 82.6% | 2.51 | 0.020 |
| May | 23 | -0.502% | -0.863% | 3.174% | 29.2% | -0.76 | 0.456 |
| June | 24 | -0.089% | +0.426% | 2.471% | 58.3% | -0.18 | 0.861 |
| July | 24 | +0.179% | -0.036% | 2.264% | 50.0% | 0.39 | 0.703 |
| August | 23 | -0.756% | -1.010% | 2.577% | 34.8% | -1.41 | 0.173 |
| September | 23 | -0.295% | -1.211% | 2.673% | 43.5% | -0.53 | 0.602 |
| October | 23 | +0.031% | +0.244% | 3.252% | 60.9% | 0.05 | 0.964 |
| November | 23 | +0.185% | -0.126% | 2.639% | 43.5% | 0.34 | 0.740 |
| December | 23 | -0.043% | +0.013% | 1.938% | 52.2% | -0.11 | 0.917 |
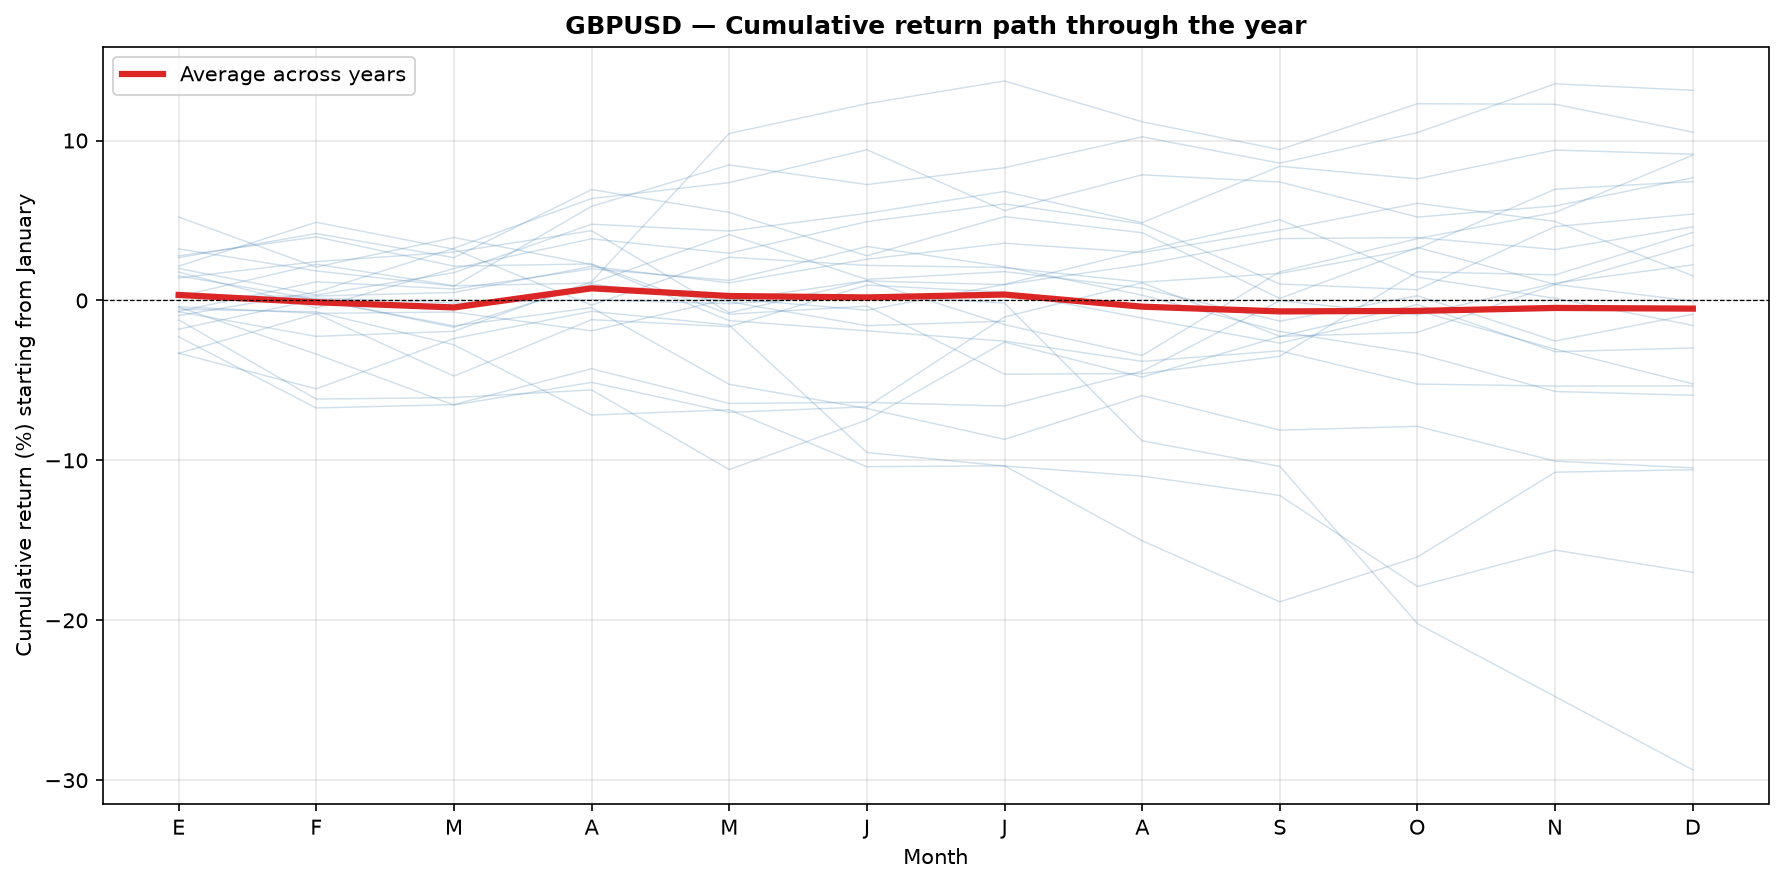
Star finding: April is bullish and significant (+1.20% mean, 82.6% win rate, p=0.020). 19 of 23 Aprils closed positive — the strongest pattern of the entire GBP/USD analysis. Combined with the weakness of May (-0.50%, win 29.2%) and August (-0.76%, win 34.8%), there is a clear seasonal effect of "strong in April, weak in summer".
3. Seasonality by trading session (UTC)
| Session | n | Mean drift % | Win rate | p-value | Mean range % | |Gap| % |
|---|---|---|---|---|---|---|
| Asian (00–07 UTC) | 6,051 | +0.0004% | 51.3% | 0.889 | 0.3079% | 0.0020% |
| London (07–12 UTC) | 6,049 | -0.0118% | 48.7% | 0.005 | 0.4794% | 0.1472% |
| NY (12–17 UTC) | 6,041 | +0.0063% | 50.6% | 0.171 | 0.5187% | 0.2831% |
| NY late (17–22 UTC) | 6,821 | +0.0030% | 50.4% | 0.190 | 0.2604% | 0.3572% |
| Weekend gap (22–24 UTC) | 6,049 | +0.0050% | 53.9% | 0.001 | 0.1393% | 0.3509% |
Findings for GBP/USD:
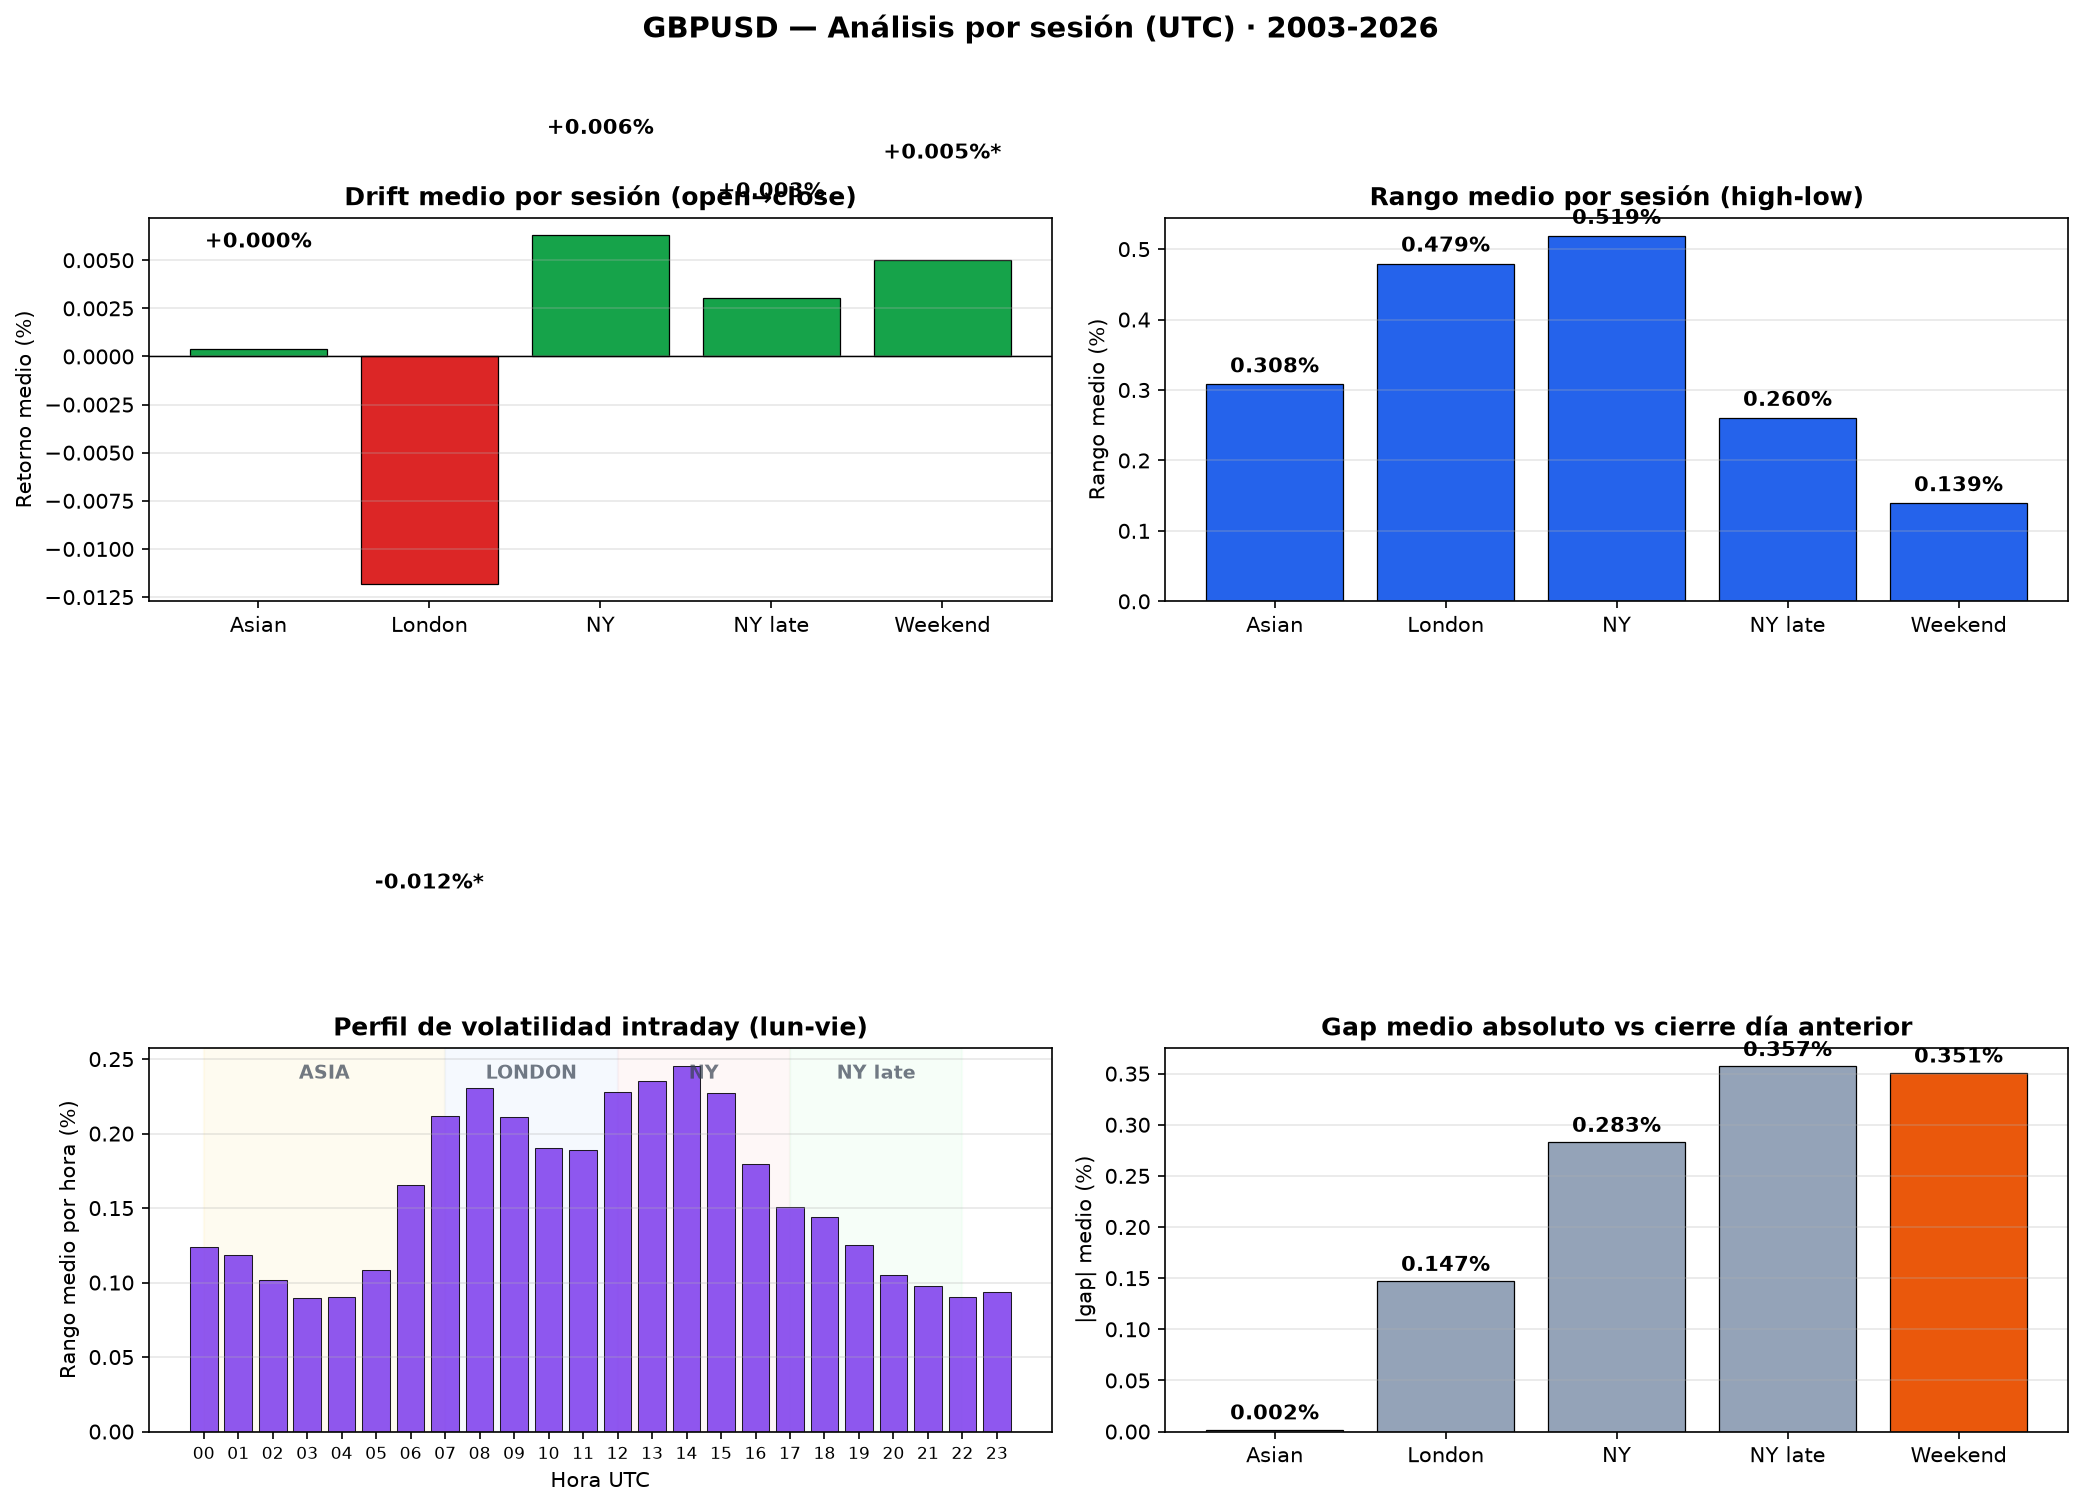
- Asian neutral: unlike EUR/USD, GBP/USD shows no significant drift in Asia. Sterling has no directional bias in that session.
- London bearish and significant: -0.012%, p=0.005. Sterling falls while London is at its peak — same pattern as EUR/USD, probably carry-trade flows.
- NY neutral: although most volatile (range 0.52%), no clear direction.
- Weekend gap bullish: +0.005% with 53.9% win rate, p=0.001.
4. Heatmap: day × session
| Day | Asian (00–07) | London (07–12) | NY (12–17) | NY late (17–22) |
|---|---|---|---|---|
| Monday | +0.003% | -0.016% | +0.007% | +0.001% |
| Tuesday | +0.001% | -0.008% | +0.015% | -0.001% |
| Wednesday | +0.003% | -0.004% | +0.015% | +0.001% |
| Thursday | +0.009% | -0.002% | -0.003% | +0.006% |
| Friday | -0.014% | -0.029% | -0.003% | -0.000% |
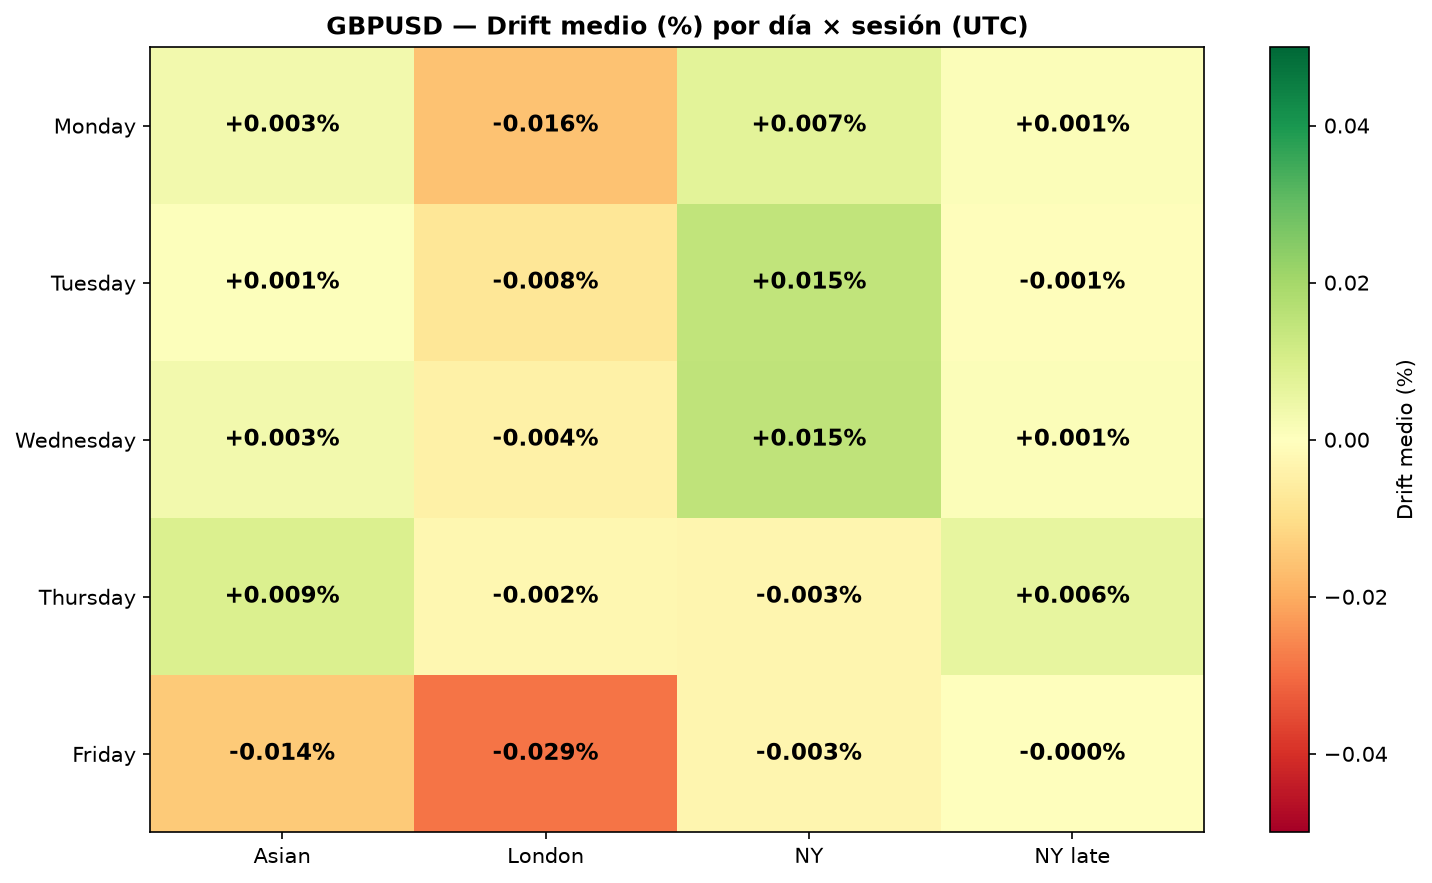
Critical finding: all Friday sessions are negative (-0.014%, -0.029%, -0.003%, -0.000%). It is the only day with universally bearish cells. The most negative cell is Friday × London (-0.029%), matching the weakest aggregated day.
Winning cells:
- 🥇 Tuesday × NY: +0.015% drift.
- 🥇 Wednesday × NY: +0.015% drift.
- 🥇 Thursday × Asian: +0.009% drift.
5. Top most volatile hours (UTC)
| Hour UTC | Mean range % | Std % | Session |
|---|---|---|---|
| 13:00 | 0.376% | 0.225 | NY open |
| 14:00 | 0.363% | 0.219 | London/NY |
| 12:00 | 0.317% | 0.205 | Pre-NY |
| 08:00 | 0.313% | 0.200 | London |
| 07:00 | 0.294% | 0.194 | London open |
| 15:00 | 0.260% | 0.184 | London/NY |
GBP/USD is more volatile at London open (07-08 UTC) than EUR/USD: 0.29-0.31% range vs 0.27-0.29% for the euro. This reflects that London is sterling's natural centre. Hot window remains 12:00-14:00 UTC (London-NY overlap).
---6. Three practical setups for GBP/USD
Setup 1 · Short bias on Fridays
- When: Friday 00-22 UTC (all sessions are negative).
- Why: -0.045% aggregated, p=0.008. 4 of 4 Friday sessions are bearish.
- Application: cleanest GBP/USD setup. Longs on Fridays have lost money for 23 years.
Setup 2 · Long bias in April
- When: all of April.
- Why: +1.20% mean, win rate 82.6%, p=0.020. 19 of 23 Aprils closed positive.
- Application: strongest GBP/USD seasonal effect. Combine with momentum: if sterling is already bullish by late March, opening long in April tends to work.
Setup 3 · Long bias Tuesday/Wednesday NY
- When: Tuesday or Wednesday 12-17 UTC.
- Why: both cells have +0.015% drift (the most positive in the heatmap). Mid-week NY is bullish for sterling.
- Filter: combine with short-term momentum. Avoid without catalyst.
What this data does NOT tell you
- April is robust but not perfect: p=0.020 is statistically significant, but 4 of 23 Aprils were negative. Not a mechanical system.
- Friday weakens further in 2020+: in the post-COVID sub-period, Friday's negative drift is -0.070% vs -0.036% pre-2020. GBP has lost more on Fridays recently.
- Transaction costs: typical retail GBP/USD spread is 0.8-1.8 pips (0.008-0.018%), higher than EUR/USD. You need ECN/STP with spread <0.8 pips.
- Brexit is an outlier: 2016-2020 includes Brexit uncertainty, which inflates volatility and distorts aggregated returns.
- DST ignored: sessions are fixed UTC buckets.
Methodology
- Source: M1 tick data (Dukascopy) for GBPUSD between May 2003 and July 2026.
- Total: 8,678,561 M1 UTC candles, aggregated into 6,060 trading days and 279 months.
- Daily return: (close_22UTC[t] - close_22UTC[t-1]) / close_22UTC[t-1] × 100.
- Monthly return: (close_lastDay - close_lastDayPrevMonth) / close_lastDayPrevMonth × 100.
- Session drift: (close_last_bar - open_first_bar) / open × 100.
- Statistical test: one-sample t-test vs zero. = p < 0.05.
- Software: Python 3.14, pandas 3.x, pyarrow, scipy, matplotlib.
For volatility-adjusted lot sizes on GBP/USD, use the position size calculator.
The full seasonality series
This study is part of a series applying the same methodology to six assets. The contrast between them is the most useful part: the index "Monday rally" does not exist in gold or the FX majors.
- XAUUSD (gold) — 23 years, best day Friday and best month January.
- EURUSD — the world's most traded pair, 23 years.
- XAGUSD (silver) — gold's more volatile sibling.
- Dow Jones (USA30) — the index "Monday rally".
- NASDAQ-100 — the strongest Monday of the six (p=0.0001).