

Your first backtest in Deepwick can start without signing up or writing a strategy from scratch. We will open the Donchian example, run its rules and check what changes when we increase the commission.
Deepwick was created by EV Trading Labs. Our project introduction explains how it fits our tools; this tutorial uses the public demo. The screenshots show the real application on 9 October 2026, using synthetic data. They teach the workflow, not the strategy’s market performance.
1. Open the example and choose your data
Open Donchian Breakout in Deepwick →
The link loads BTCUSDT on the one-hour timeframe and Donchian Breakout Strategy. To reproduce this exercise, use the sample-data button above the chart (labelled Usar datos de ejemplo in the Spanish interface shown here). The symbol changes to SAMPLE and a banner identifies the data as synthetic rather than market prices.
Check that banner before comparing numbers. BTCUSDT and SAMPLE are different datasets. If market data is slow to load, you can continue with the offline example.
2. Read the rules before pressing Run
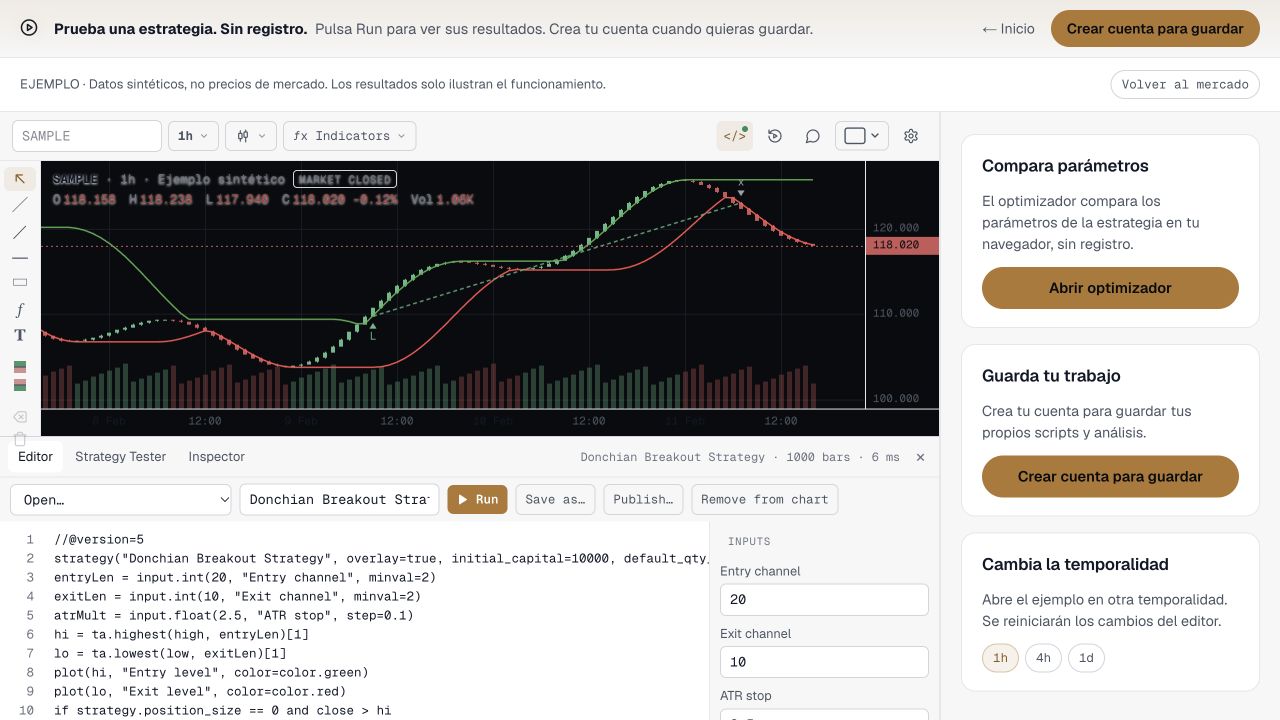
Open Editor. The example has three inputs: Entry channel = 20, Exit channel = 10 and ATR stop = 2.5.
- Entry: opens a long position when flat and the close exceeds the highest high of the previous 20 bars.
- Channel exit: requests a close when price closes below the lowest low of the previous 10 bars.
- Stop: calculates a level 2.5 times the 14-period ATR below the average entry price. The script recalculates it while holding the position; it does not freeze ATR at entry.
These lines use [1] to retrieve the channel calculated on the previous bar:
hi = ta.highest(high, entryLen)[1]
lo = ta.lowest(low, exitLen)[1]
The signal bar therefore does not enter the channel against which it is compared. Initial capital is 10,000 and position size is 20% of equity. That 20% is position size, not maximum risk per trade.
3. Run the strategy and open Strategy Tester
Press Run or Ctrl/⌘ + Enter, then open Strategy Tester. If the demo already ran the script on load, this repeats the calculation with the code currently in the editor.
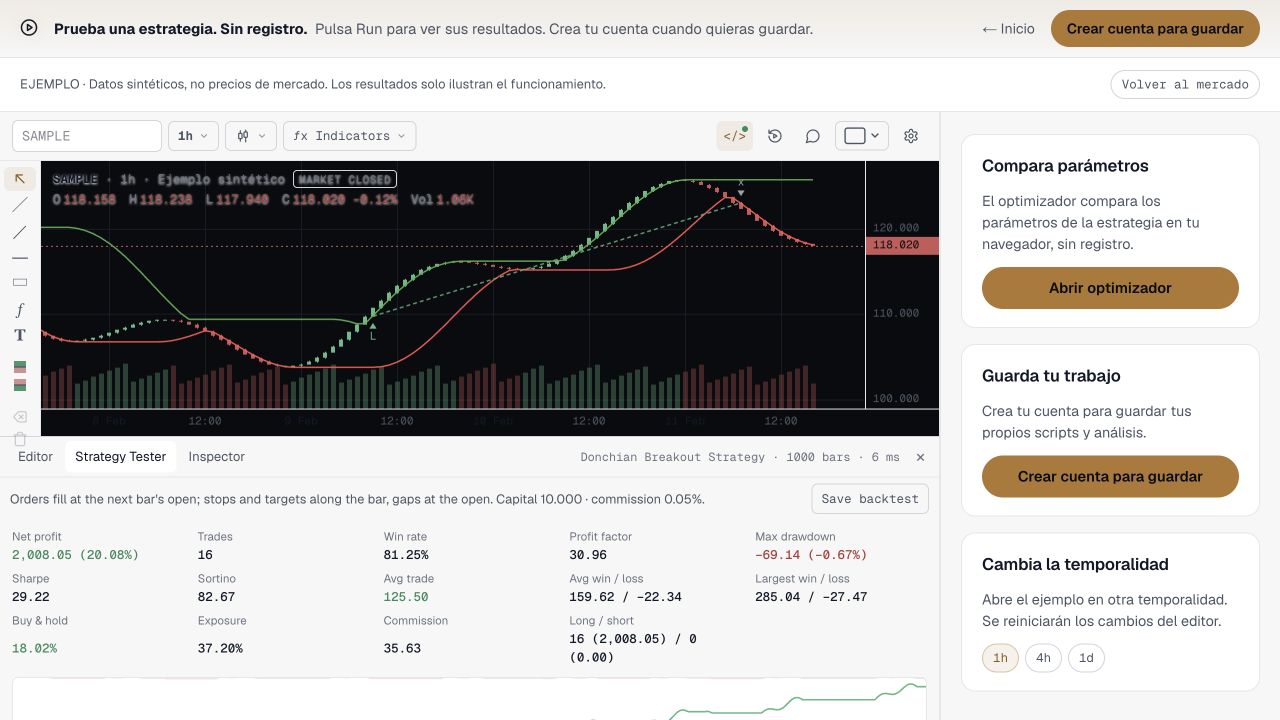
Our check showed 1,000 bars and 16 trades. Also check the capital and commission displayed above the metrics. Market orders fill at the next bar’s open, so distinguish the signal bar from the entry bar.
4. Read more than net profit
- Trades: the number of trades. Sixteen trades on an artificial example do not validate a strategy.
- Max drawdown: the decline from a previous peak in simulated equity. Inspect its path as well as its headline value.
- Profit factor: compares aggregate gains and losses. A high value based on very few losses can be fragile.
- Commission: total commission charged, rather than the percentage configured for each execution.
Below the metrics are the equity curve and trade table. Click a row to locate a trade on the chart, then compare entry, exit and the exit reason, such as stop or close. This helps establish whether the code does what you thought it did.
5. Change one thing: commission
Return to Editor. In strategy(...), replace only commission_value=0.05 with commission_value=0.10. Keep commission_type=strategy.commission.percent and press Run again.
Here, 0.05 means 0.05% per execution, not 5%. We ran both configurations on the same 1,000 synthetic bars:
| Demo metric | 0.05% commission | 0.10% commission |
|---|---|---|
| Trades | 16 | 16 |
| Total commission | 35.63 | 71.15 |
| Simulated net profit | 2,008.05 | 1,969.01 |
Amounts are in the simulation’s monetary units. The net-profit difference is not exactly the difference in commissions because position size depends on equity, which also changes. These results describe the version checked on 9 October; updates to the example may change them.
This exercise isolates commission only. The base script does not declare slippage, and these numbers do not establish that every real execution cost is represented.
6. Move from the exercise to research
Once you understand the workflow, use the button to return to market data (Volver al mercado in our screenshots). Record the symbol, provider, timeframe, bar dates, code, inputs and costs. Changing timeframe with the demo buttons resets editor changes, so copy your code first.
Use the create-account option if you want to save your work. Then evaluate another period without retuning the rules for each sample. Our walk-forward and backtesting guide explains that separation between training and evaluation.
The goal of this first session is to explain every trade and repeat the experiment. A positive curve, especially on artificial data, does not demonstrate a trading edge or guarantee future results.