

Does Bitcoin have days, months or hours with a bias you can actually measure? We aggregated 3,902,959 M1 candles of BTCUSD from May 2017 to October 12, 2026 by day of week, calendar month, session and UTC hour, and ran every result through a significance test. Bottom line: 4 of the 18 calendar buckets come out at p < 0.05, but none survives a multiple-comparison correction. A hint, not a rule.
📊 The data behind this article, as tables and CSV: /stats/BTCUSD publishes Bitcoin seasonality, sessions and spread as a downloadable reference, and /data has the OHLCV candles (D1 down to M1) so you can replicate every table. This article is the analysis, with its tests; those pages are the raw numbers.
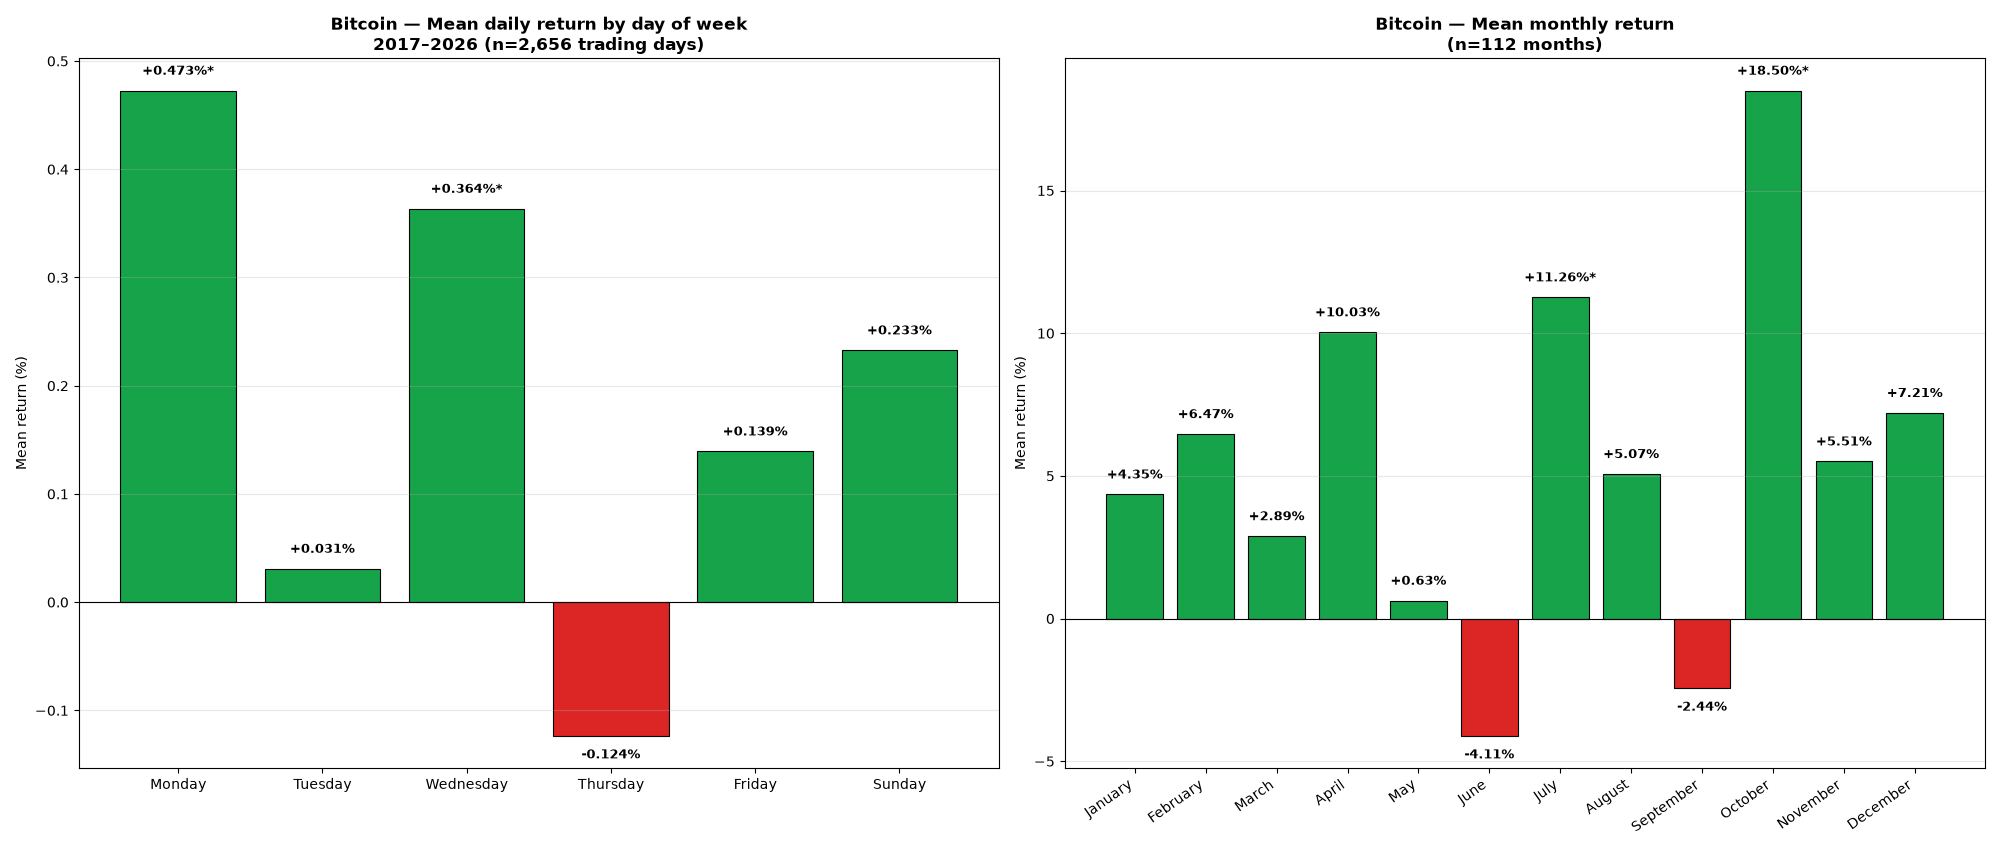
1. Seasonality by day of the week
Each day closes at 00:00 UTC (UTC calendar day). Note: the Dukascopy CFD does not trade on Saturdays, so the Sunday return also contains Saturday's move. Test: one-sample t-test against zero; bold marks what survives a Bonferroni correction.
| Day | n | Mean % | Median % | Std % | Win rate | t-stat | p-value |
|---|---|---|---|---|---|---|---|
| Monday | 480 | +0.473% | +0.054% | 4.055% | 50.8% | 2.55 | 0.011 |
| Tuesday | 491 | +0.031% | -0.095% | 3.546% | 48.7% | 0.19 | 0.847 |
| Wednesday | 489 | +0.364% | +0.178% | 3.742% | 52.4% | 2.15 | 0.032 |
| Thursday | 491 | -0.124% | -0.153% | 4.257% | 47.3% | -0.64 | 0.520 |
| Friday | 354 | +0.139% | +0.048% | 3.414% | 51.4% | 0.77 | 0.443 |
| Sunday | 351 | +0.233% | +0.183% | 3.017% | 52.1% | 1.45 | 0.149 |
Reading: days with p < 0.05:
- Monday: +0.473% on average, 50.8% win rate, p=0.011, but it does not clear the Bonferroni threshold for 6 tests (0.0083). Across the two halves of the sample (2017–2022: +0.550%; 2022–2026: +0.383%) the sign holds.
- Wednesday: +0.364% on average, 52.4% win rate, p=0.032, but it does not clear the Bonferroni threshold for 6 tests (0.0083). Across the two halves of the sample (2017–2022: +0.343%; 2022–2026: +0.389%) the sign holds.
2. Seasonality by month of the year
112 complete months (the current month is left out). Each month's return = last close of the month against the last close of the previous month.
| Month | n | Mean % | Median % | Std % | Win rate | t-stat | p-value |
|---|---|---|---|---|---|---|---|
| January | 9 | +4.35% | +1.17% | 22.40% | 55.6% | 0.58 | 0.576 |
| February | 9 | +6.47% | +1.37% | 22.32% | 66.7% | 0.87 | 0.410 |
| March | 9 | +2.89% | +5.41% | 20.76% | 66.7% | 0.42 | 0.687 |
| April | 9 | +10.03% | +11.93% | 18.79% | 66.7% | 1.60 | 0.148 |
| May | 9 | +0.63% | -3.56% | 26.38% | 44.4% | 0.07 | 0.945 |
| June | 10 | -4.11% | -4.63% | 19.30% | 40.0% | -0.67 | 0.517 |
| July | 10 | +11.26% | +10.70% | 11.96% | 80.0% | 2.98 | 0.016 |
| August | 10 | +5.07% | -6.22% | 24.33% | 40.0% | 0.66 | 0.527 |
| September | 10 | -2.44% | -4.23% | 7.52% | 40.0% | -1.03 | 0.331 |
| October | 9 | +18.50% | +10.86% | 20.02% | 77.8% | 2.77 | 0.024 |
| November | 9 | +5.51% | -7.11% | 32.91% | 44.4% | 0.50 | 0.629 |
| December | 9 | +7.21% | -3.29% | 23.02% | 33.3% | 0.94 | 0.375 |
Reading: months with p < 0.05:
- July: +11.26% on average, 80.0% win rate, p=0.016, but it does not clear the Bonferroni threshold for 12 tests (0.0042). Across the two halves of the sample (2017–2021: +16.27%; 2022–2026: +6.25%) the sign holds.
- October: +18.50% on average, 77.8% win rate, p=0.024, but it does not clear the Bonferroni threshold for 12 tests (0.0042). Across the two halves of the sample (2017–2021: +25.06%; 2022–2026: +10.30%) the sign holds.
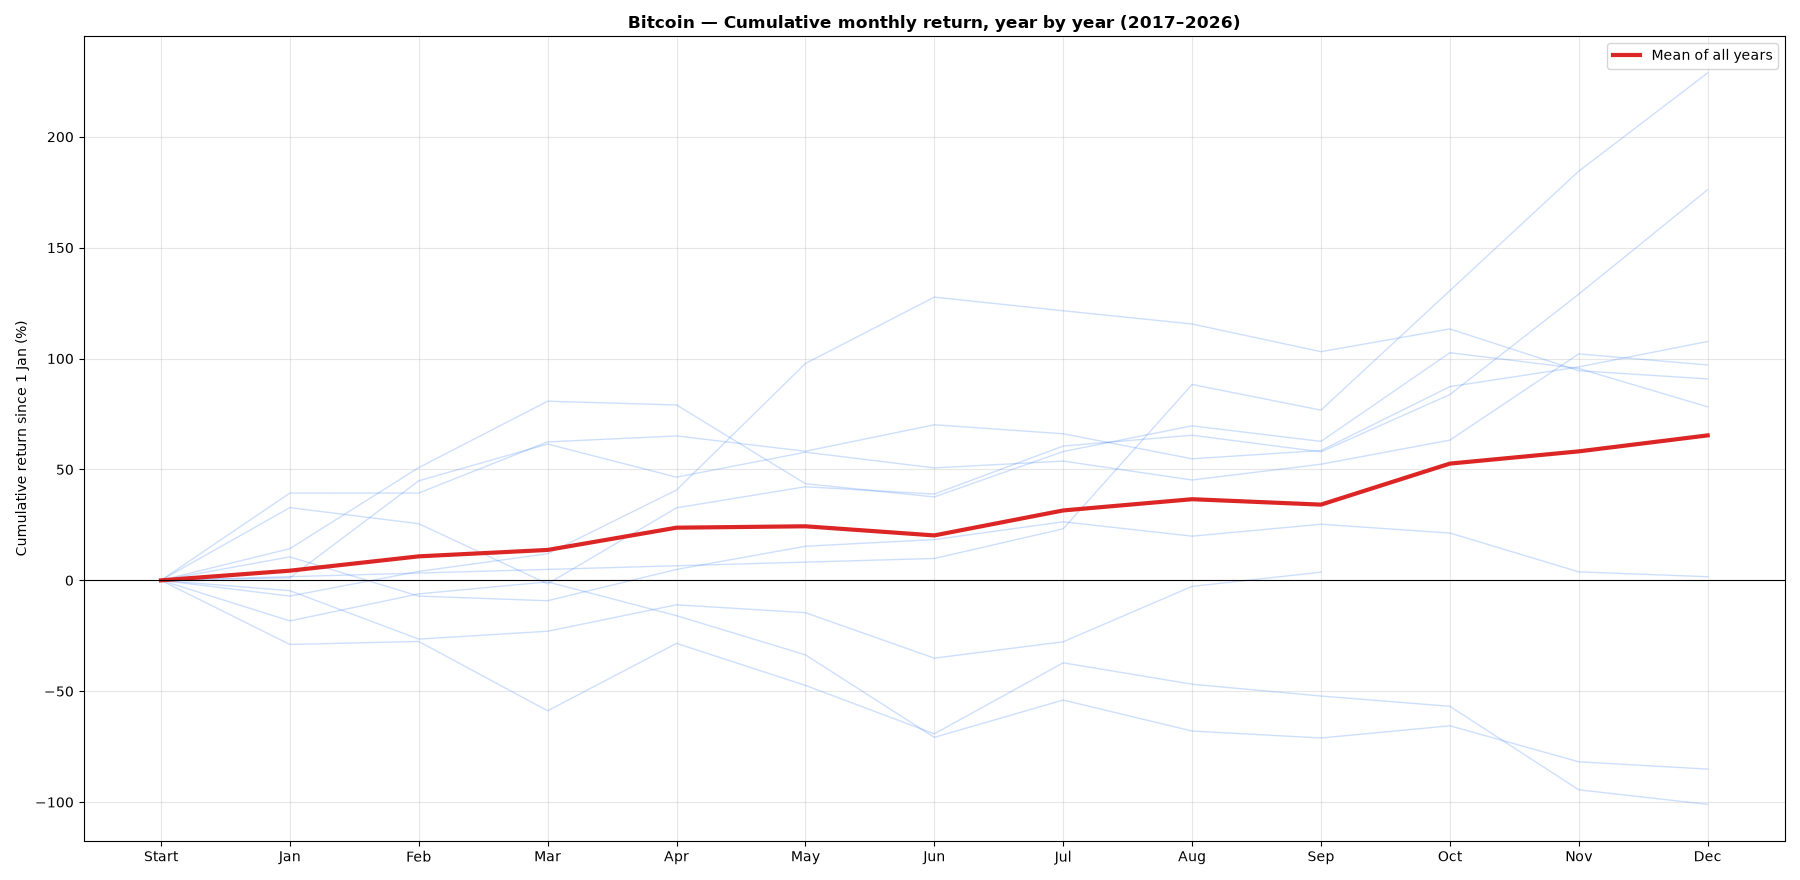
Each thin line is one year; the red one is the mean. When the thin lines fan out, a month's average says little about next year.
3. Seasonality by trading session (UTC)
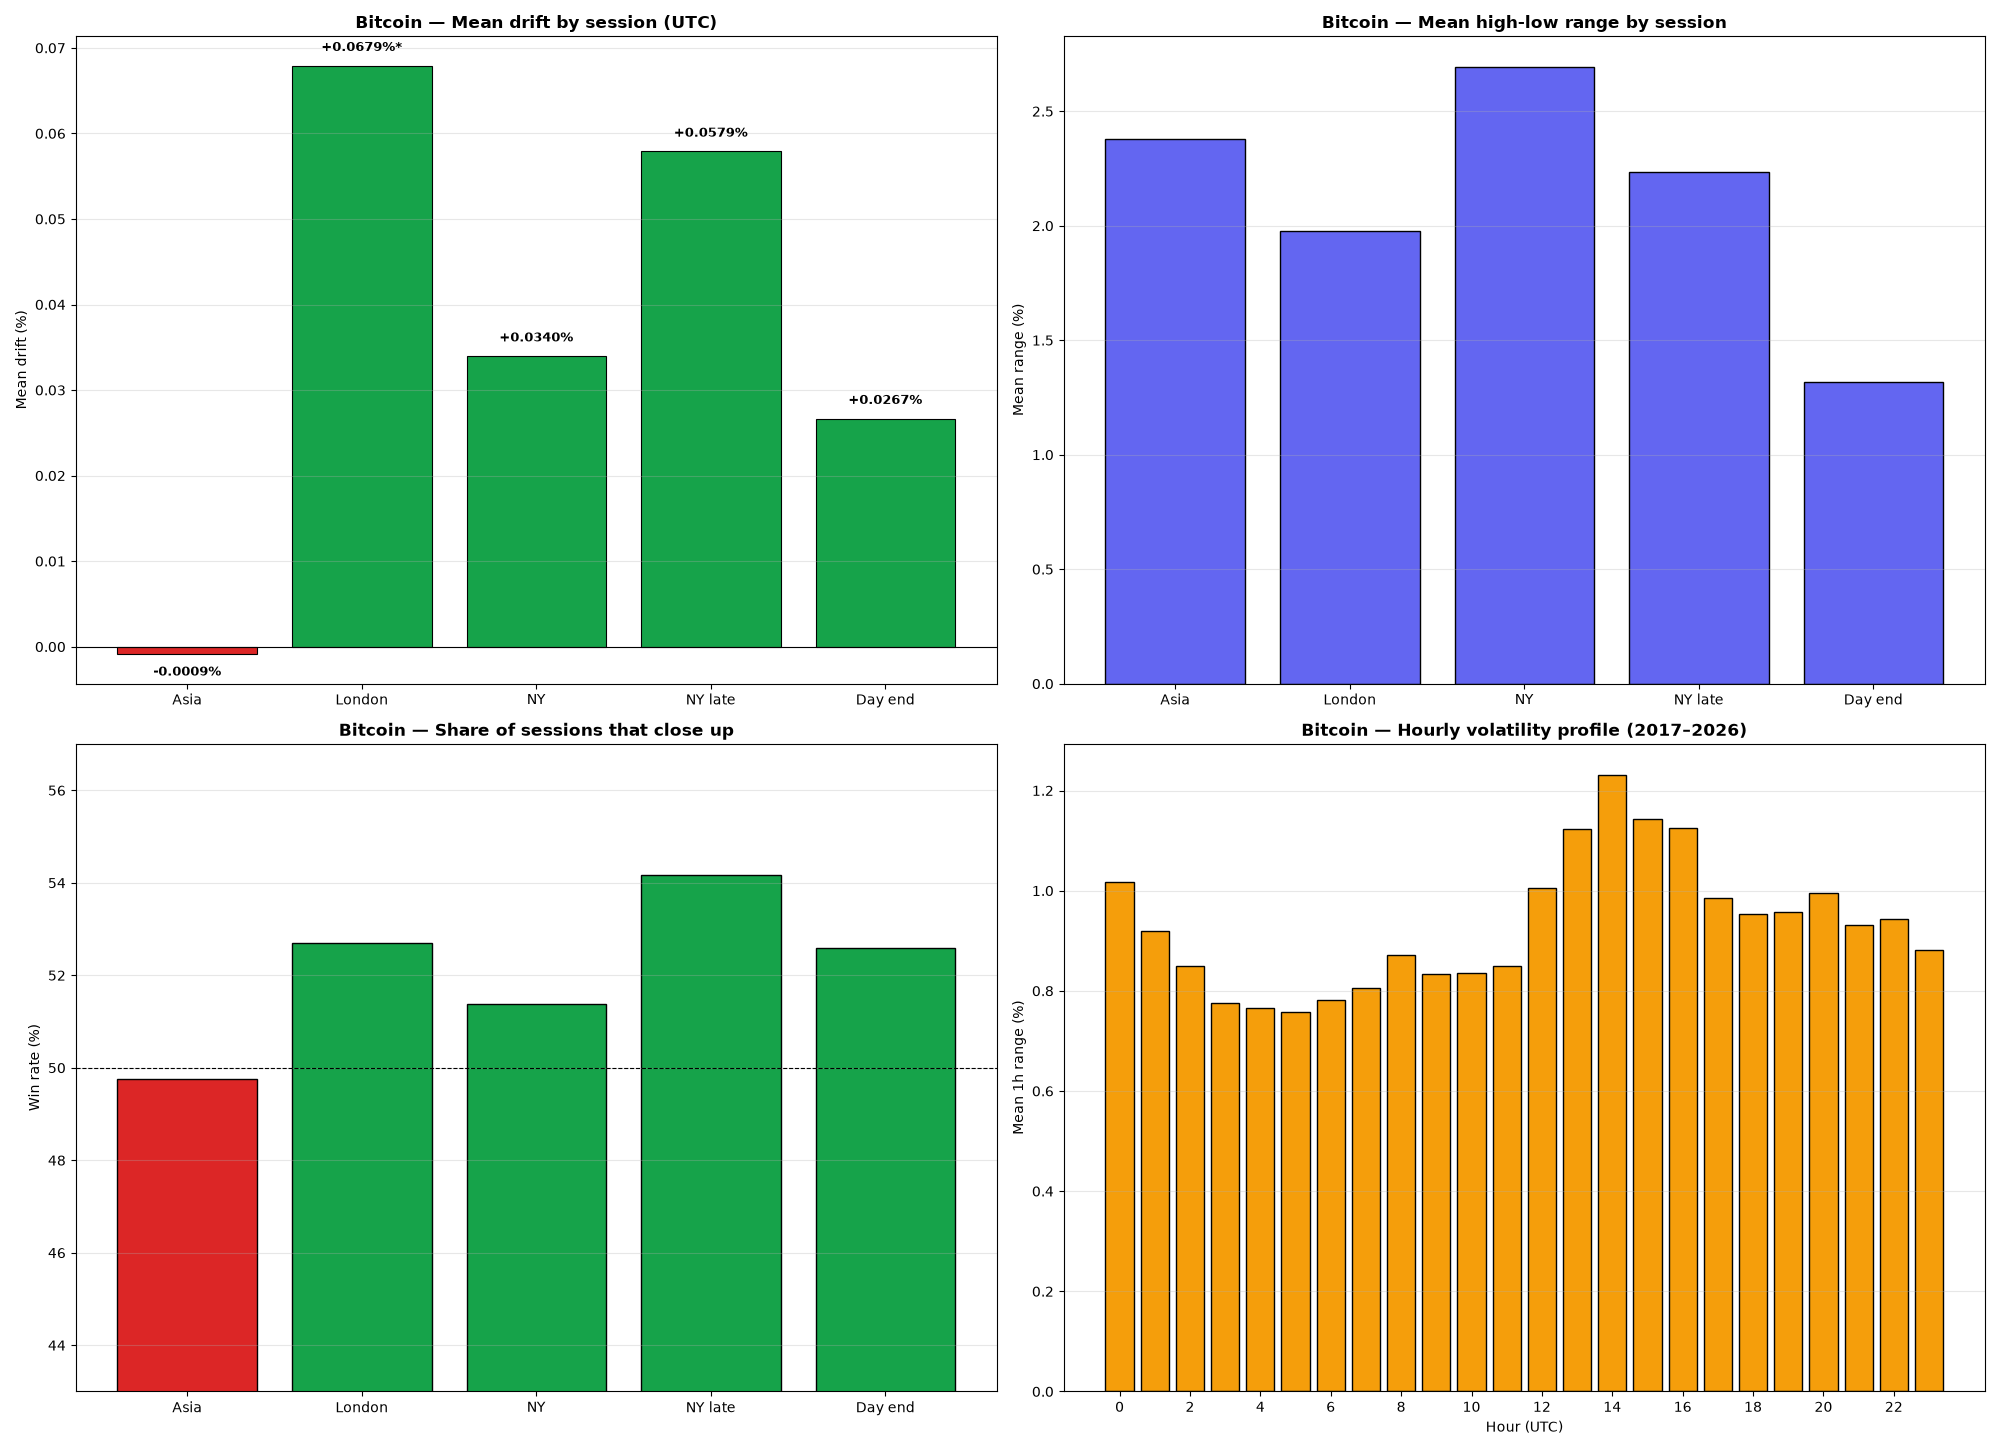
Fixed UTC windows, the same across the whole series. Drift = session close against its open; range = high minus low, as % of the open.
| Session | n | Mean drift % | Win rate | p-value | Mean range % |
|---|---|---|---|---|---|
| Asia (00–07 UTC) | 2,747 | -0.0009% | 49.8% | 0.980 | 2.380% |
| London (07–12 UTC) | 2,744 | +0.0679% | 52.7% | 0.025 | 1.977% |
| New York (12–17 UTC) | 2,750 | +0.0340% | 51.4% | 0.359 | 2.693% |
| NY late (17–22 UTC) | 2,745 | +0.0579% | 54.2% | 0.056 | 2.235% |
| Day end (22–24 UTC) | 2,744 | +0.0267% | 52.6% | 0.198 | 1.318% |
- New York (12–17 UTC) is where it moves: mean range 2.693%, 2.0× that of Day end (22–24 UTC).
- London (07–12 UTC) drifts up with p=0.025 (+0.0679% per session), though it does not clear Bonferroni. It is a small bias: compare it with the spread before thinking of trading it.
4. Day × session heatmap
| Day | Asia (00–07) | London (07–12) | New York (12–17) | NY late (17–22) | Day end (22–24) |
|---|---|---|---|---|---|
| Monday | +0.041% | +0.039% | +0.144% | +0.137% | +0.076% |
| Tuesday | -0.027% | +0.029% | +0.026% | +0.010% | +0.053% |
| Wednesday | +0.130% | +0.103% | +0.059% | +0.060% | +0.037% |
| Thursday | -0.052% | +0.031% | -0.111% | +0.038% | -0.043% |
| Friday | -0.131% | +0.157% | +0.103% | +0.027% | +0.054% |
| Sunday | +0.054% | +0.037% | -0.044% | +0.085% | -0.007% |
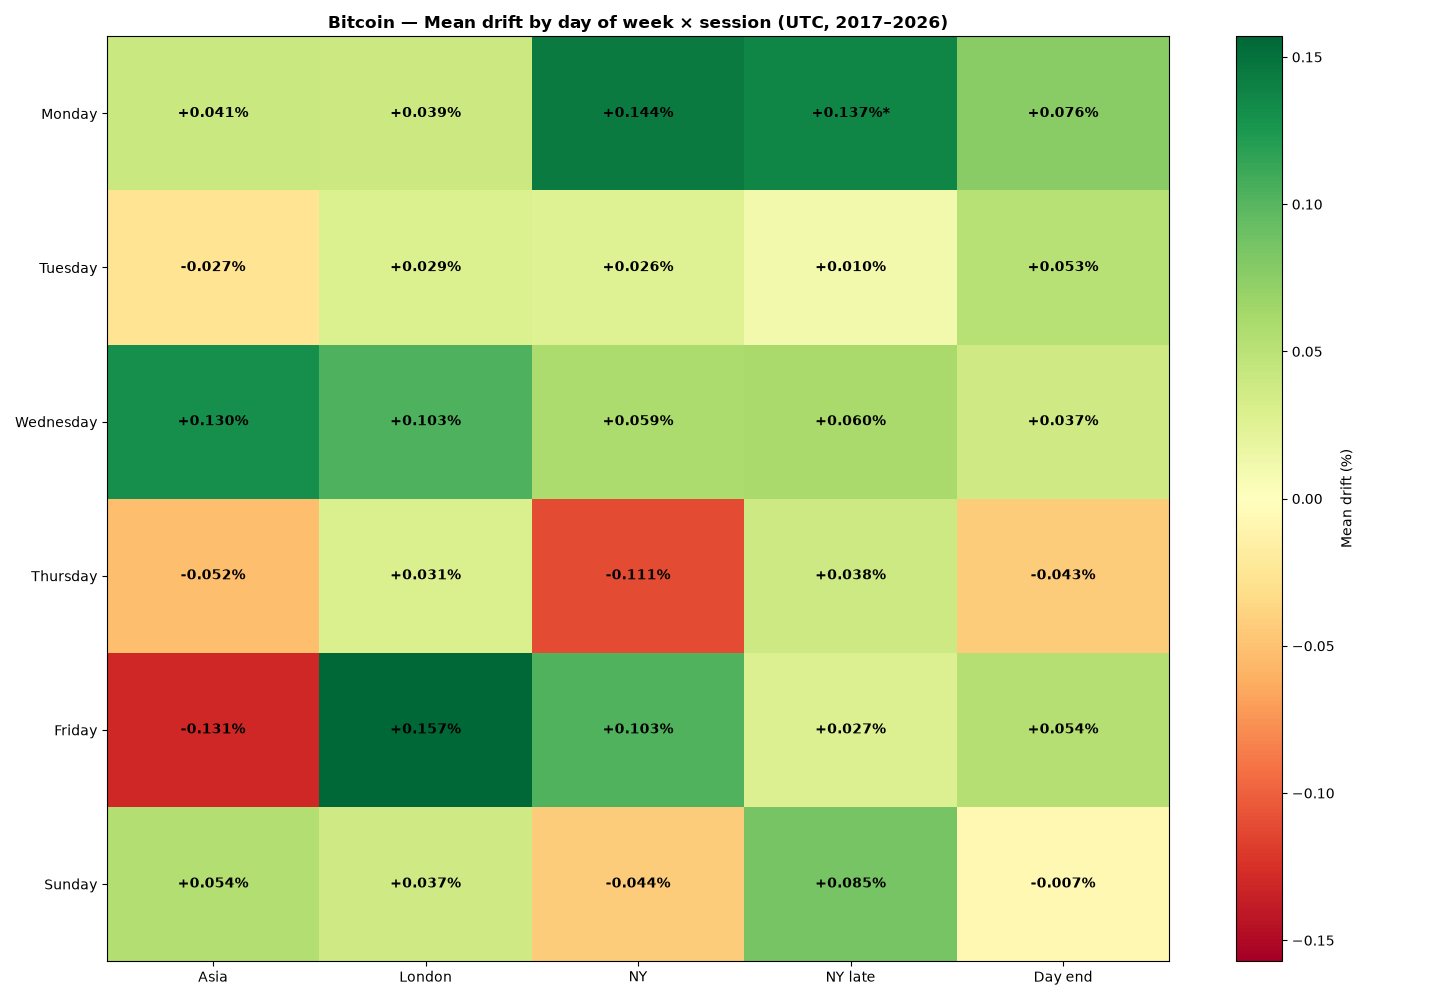
- Most bullish cell: Monday × NY late (+0.137%, p=0.042). Most bearish: Friday × Asia (-0.131%, p=0.120).
- 1 of 30 cells comes out at p < 0.05; chance alone would give about 1.5. That is what chance produces: do not read the heatmap as a signal map.
5. Most volatile hours (UTC)
| UTC hour | Mean range % | Mean range ($) | Std % | Session |
|---|---|---|---|---|
| 14:00 | 1.231% | 485.9 | 1.048 | NY |
| 15:00 | 1.143% | 440.7 | 0.951 | NY |
| 16:00 | 1.125% | 399.5 | 0.997 | NY |
| 13:00 | 1.124% | 411.6 | 1.052 | NY |
| 00:00 | 1.017% | 351.8 | 0.914 | Asia |
| 12:00 | 1.006% | 339.4 | 1.002 | NY |
The busiest hour (14:00 UTC) moves 1.6× more than the quietest (05:00 UTC, 0.757%). Unlike the calendar bias, this is stable year to year: it is the most useful part of this analysis for deciding when to be at the screen or where to place a stop.
6. What it costs to trade: the measured spread
The feed carries real bid and ask, so the spread is measured, not a broker's marketing figure. Median since 2017: 75.50 $. But a spread in $ does not say how heavy it is: what matters is how much of the hour's typical move it eats.
| UTC hour | Median spread ($) | Mean range ($) | Cost |
|---|---|---|---|
| 14:00 | 75.20 | 485.5 | 15.5% |
| 15:00 | 75.20 | 440.4 | 17.1% |
| 13:00 | 75.20 | 411.2 | 18.3% |
| 05:00 | 75.60 | 251.8 | 30.0% |
| 04:00 | 75.60 | 260.0 | 29.1% |
| 06:00 | 75.50 | 264.2 | 28.6% |
Trading at 14:00 UTC costs 15.5% of the hour's range; at 05:00 UTC, 30.0%. The cross-market comparison is in the real spread by market and hour.
What this data does not tell you
- Multiple comparisons: this article runs 53 tests (6 days, 12 months, 5 sessions and 30 cells). At a 5% threshold about 3 would come out "significant" by chance. That is why what survives Bonferroni is flagged separately.
- Few years per month: each month has about 9 observations. One extreme year can create or erase a "bullish month".
- An average bias is not a strategy: after spread, commission and swap, a drift of hundredths of a percent per session rarely survives. Before trading it, backtest with real costs and walk-forward.
- This is not a 24/7 exchange price: it is the Dukascopy CFD, which pauses on Saturdays. A study on Binance or Coinbase would see seven days and split the weekend differently.
- A young series with shifting regimes: crypto went from a retail market to spot ETFs within this sample. What held in 2018 may not hold today.
Methodology
- Source: Dukascopy ticks aggregated to M1 candles by EV Trading Labs (Bitcoin, 2017-05-08 → 2026-10-12).
- Total: 3,902,959 M1 candles with at least one tick; 2,656 daily and 112 monthly returns.
- Price: open and close at mid price (bid+ask)/2; high and low on the bid. Where the feed has no ask, bid.
- Daily return: (C[t] − C[t−1]) / C[t−1] × 100, where C is the close at 00:00 UTC. Days with fewer than 60 candles, or whose last candle is more than 3 h before the cut-off, are dropped.
- Monthly return: last daily close of the month against the previous month's; the current month is excluded.
- Sessions: drift = (close − open) / open × 100; range = (high − low) / open × 100; sessions with less than 40% of their minutes are dropped.
- Test: one-sample t-test against zero, p < 0.05; Bonferroni per block (days, months, sessions, cells). Stability: the same mean computed on each half of the sample.
- Software: Python, pandas, scipy, matplotlib.
The full seasonality series
The same method applied to 19 markets. The contrast between them is the most useful part: a pattern that shows up in a single asset is more likely to be noise.
- Forex: EURUSD · GBPUSD · USDJPY · GBPJPY · AUDUSD · USDCHF · EURGBP
- Metals: XAUUSD (gold) · XAGUSD (silver)
- Indices: Dow Jones · NASDAQ-100 · S&P 500 · DAX 40 · FTSE 100 · Nikkei 225
- Oil: Brent · WTI
- Crypto: Ethereum